website-BergenJamie
Week 1 Project idea: Image analysis with machine learning on images of microglia to determine activation levels.
I’m also very interested in training two neural networks to compare the activation to see if there is anything quantifiable about the weights that are usually described quantitatively in biology research.
I have the project idea but hadn’t met with my advisor to discuss it before our first meeting. Decided to start researching the idea in more detail. So I started writing a paper. I haven’t worked with images of microglia and I don’t know much about them so I started there. Here is the introduction I wrote and some snippets of the background information I wrote.
Introduction Microglia are a type of glial cell that serve as the resident immune cells of the central nervous system (CNS). They play a critical role in maintaining the health and function of the CNS, including maintaining the balance between neuroprotective and neuroinflammation. (Colonna and Butovsky, 2017, and Wake, 2011) In recent years, there has been growing interest in the role of microglia in various neurological disorders, including Alzheimer’s disease, Parkinson’s disease, and multiple sclerosis. However, the methods for understanding morphology and behavior of microglia have been shown to be limited and inconsistent (Green et al, 2022). While there are promising new developments in deep learning for the classification of microglia, the behavior of these networks remains elusive. This paper aims to provide an overview of methods for microglia classification using deep learning, as well as to propose several methods of network analysis to improve and draw additional conclusions about the morphology of microglia.
Function of Microglia
Microglia are the resident immune cells of the central nervous system (CNS) and play a critical role in maintaining the health and function of the CNS. They are involved in a wide range of functions, including immune surveillance, phagocytosis, synaptic pruning, and regulation of inflammation (Wake, 2011).
One of the primary functions of microglia is immune surveillance. Microglia are constantly surveying the CNS for any signs of damage, infection, or other abnormalities (Ukpong B Eyo, Long-Jun Wu, 2019). They use their long, thin processes to interact with neurons and other glial cells, monitoring the activity of the CNS and detecting any changes that may indicate a threat. When microglia detect a potential threat, they become activated and migrate to the site of the injury or infection to investigate further (ibid).
Once activated, microglia can perform a variety of immune functions. One of the most important of these functions is phagocytosis. Microglia are able to engulf and digest cellular debris, dead cells, and foreign pathogens, helping to clear them from the CNS. This function is critical for maintaining the health of the CNS, as the accumulation of debris or dead cells can lead to inflammation and tissue damage (Brown and Neher, 2014).
Microglia are also involved in the process of synaptic pruning, which is important for the development and maintenance of neural circuits. (Paolicelli et al. 2011) During early development, the CNS produces an excess of synapses, which are gradually pruned back to create more efficient neural circuits. Microglia play a key role in this process by engulfing and eliminating unwanted synapses. This function is important for maintaining the proper balance of neural connections in the CNS and ensuring optimal neural function (ibid).
In addition to their immune functions, microglia are also involved in regulating inflammation in the CNS. (Wake, 2011) Inflammation is a natural response to injury or infection, but excessive or prolonged inflammation can lead to tissue damage and neurodegeneration. Microglia are able to produce a variety of anti-inflammatory and pro-inflammatory cytokines, which help to modulate the inflammatory response and prevent tissue damage. (Colonna and Butovsky, 2017) They can also interact with other immune cells in the CNS, such as T cells and B cells, to coordinate the immune response and limit damage to healthy tissue.
Microglia are also involved in a number of other functions, including regulation of blood flow in the CNS, production of growth factors that promote neural survival and regeneration, and modulation of neural activity (Ginhoux and Garel, 2018). They play a critical role in the development and function of the CNS, and are important for maintaining the health and well-being of the nervous system.
Week 2
I discussed the project idea with my lab, and they are excited about it though they want me to do more research on existing networks for image analysis in biology. So this week I worked on that a bit as well as fleshing out my background information on microglia morphology based on activation and sex dependencies
Microglia Morphology
Microglia are the smallest and most abundant glial cells in the central nervous system (CNS), accounting for approximately 10-15% of all cells in the brain. (Bachiller et al, 2018) They are derived from myeloid progenitor cells and are characterized by their unique morphology and functional properties. In their resting state, microglia have a small cell body with long, thin processes that extend from the cell body, giving them a characteristic “ramified” appearance. These processes are highly dynamic and can extend and retract in response to changes in the environment (Castano et al, 2002). This allows microglia to constantly monitor the CNS and respond to any changes or threats that may arise.
________the morphology section is very long___________
Existing Computational Methods
In addition to the traditional methods for quantifying microglia morphology and activation, several computational tools have been developed to aid in the analysis of microglia in brain tissue. These tools can automate the quantification of microglia and provide objective and quantitative measures of microglia morphology and activation.
One widely used tool is the ImageJ software, which is a free and open-source image analysis software developed by the National Institutes of Health. ImageJ provides a range of tools for image processing and analysis, and several plugins have been developed specifically for the analysis of microglia in brain tissue. For example, the MorphoLibJ plugin provides a range of tools for the analysis of microglia morphology, including measures of cell size, shape, and texture, while the Microglia Analyzer plugin provides tools for the quantification of microglia activation markers.
Another popular tool for the analysis of microglia is Imaris, which is a commercial software package developed by Bitplane. Imaris provides advanced tools for image processing and analysis, including 3D rendering, colocalization analysis, and object tracking. Imaris also provides specific tools for the analysis of microglia, including tools for the quantification of cell size, shape, and texture, and tools for the analysis of microglia activation markers.
CellProfiler is another open-source software package that can be used for the analysis of microglia morphology and activation. CellProfiler provides a range of tools for image processing and analysis, and several modules have been developed specifically for the analysis of microglia. For example, the Object Identification module can be used to identify microglia in images, while the Texture module can be used to quantify microglia activation markers.
Deep learning algorithms are also being developed for the analysis of microglia in brain tissue. These algorithms use artificial neural networks to learn patterns in microglia morphology and activation, and can provide highly accurate and efficient methods for quantifying microglia in large datasets. For example, one recent study developed a deep learning algorithm that could accurately classify microglia into different activation states based on their morphology.
While these computational tools provide powerful methods for the analysis of microglia in brain tissue, it is important to note that they still have their limitations. For example, the accuracy of these tools can be affected by the quality of the imaging data, and the choice of parameters used for analysis can affect the specificity and sensitivity of the quantification. Additionally, the interpretation of the results still requires human input, and the choice of appropriate statistical analyses is crucial to accurately interpret the data. Overall, these computational tools provide powerful methods for the objective and quantitative analysis of microglia morphology and activation, and will continue to play an important role in advancing our understanding of the role of microglia in health and disease.
Week 3 I got very little done this week. I added a little to the paper but I was dealing with some medical stuff.
Week 4
Met with Professor Plancher about my project since we hadn’t met yet. I explained I was working on a paper but my computer broke the previous week so I lost some of it and couldn’t show him in class. We decided I need to simplify my problem a bit just to see if it would even work. So I’m gonna aim to finish the paper this week so I can start actually coding next week.
Update: Paper is pretty much finished. Will upload as a separate page of this website, it is about 20 pages.
Week 5
I finished the paper last week and am simplifying the problem. I will generate images of circles and squares and train neural networks to identify if they are circles or squares. Then work on network analysis to compare the two networks, probably with a heatmap comparing the nodes in each layer.
Here is the code I wrote this week for generating the shapes and putting them into a folder, and keeping track of their labels with a csv file. I honestly had more trouble with this than I expected I would, since I don’t have much experience with using code to write to a csv file and so had to research and use a few libraries I wasn’t familiar with.
# Define the classes
classes = ["circle", "square"]


# Create the folder to store the images
if not os.path.exists("images"):
    os.makedirs("images")


# Create a spreadsheet to track the images and their shapes
csv_filename = "image_shapes.csv"
with open(csv_filename, "w", newline="") as csv_file:
    writer = csv.writer(csv_file)
    writer.writerow(["Image filename", "Shape"])


# Generate 50 images
for i in range(500):
    # Randomly decide whether to generate a circle or square
    shape = random.choice(classes)


    # Randomly generate dimensions for the shape
    width = random.randint(100, 500)
    height = random.randint(100, 500)


    # Calculate the position of the shape at random
    x1 = random.randint(0, 1000 - width)
    y1 = random.randint(0, 1000 - height)
    x2 = x1 + width
    y2 = y1 + height


    # Create a new image
    image = Image.new("RGB", (1000, 1000), color="white")


    # Draw a black circle or square on the image
    draw = ImageDraw.Draw(image)
    if shape == "circle":
        draw.ellipse((x1, y1, x2, y2), fill="black")
    else:
        draw.rectangle((x1, y1, x2, y2), fill="black")


    # Save the image in the images folder
    filename = f"{shape}_{i}.png"
    image.save(os.path.join("images", filename))


    # Write a row in the spreadsheet
    with open(csv_filename, "a", newline="") as csv_file:
        writer = csv.writer(csv_file)
        writer.writerow([os.path.join("images", filename), shape])


    # Display the first image and exit the loop
    if i == 0:
        image.show()
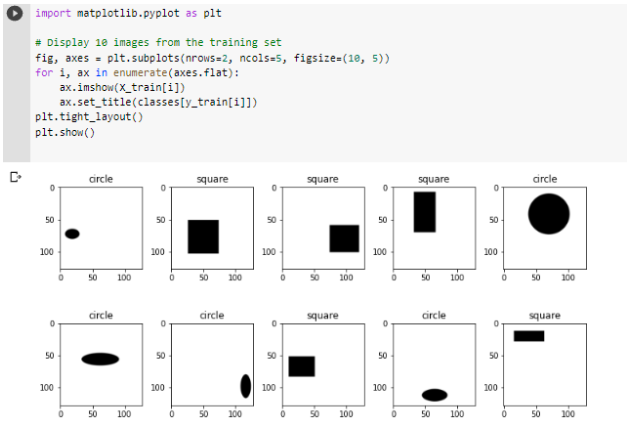
Here are some of the outputs
Week 6
I’m working on creating and training the neural network. I have tried a bunch of different network structures but it keeps defaulting to memorizing the training set and then guessing on the validation set. On the other hand, I learned how to do some neat visualizations for neural networks.
Training the Neural Network
-larger network complexity -added dropout Modified the generator to place the files in one folder because it was’t splitting properly leading to the bad validation numbers
I think the model is just memorizing the dataset. Here are more things I have tried that have not worked yet. Adding data augmentation Reducing complexity Transfer learning with a cnn on top Also shuffle the order of the images.
Week 7 It’s break. I’m not going to work on this much because I have been super burned out with other academic stuff and applying for jobs. My goal is just to get the website running, and I’ll upload this material on Monday.
Update: Making the website is harder than I thought it would be, I want to enjoy my break instead of stressing over it so I will be going to office hours on monday.
Week 8 Meeting with Professor Plancher’s office hours to get all of this on the website.
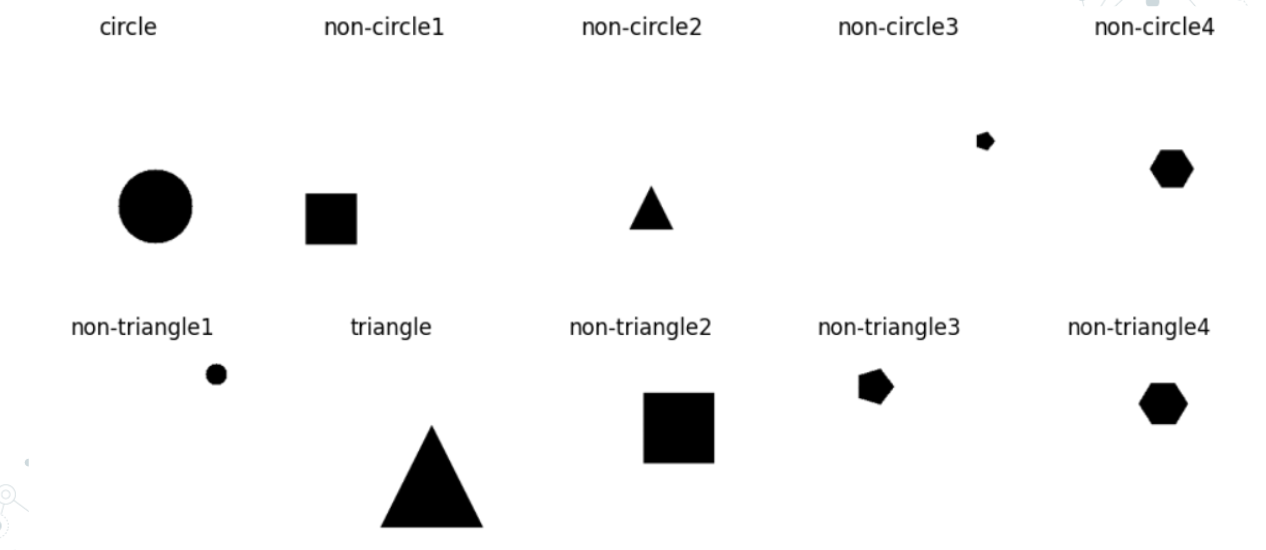
Week 9 Starting from scratch to generate more kinds of shapes, also think I’m going to simplify the neural network.
Got new code to generate and label more kinds of shapes, and label them appropriately for the two neural networks I’ll make.
Week 10
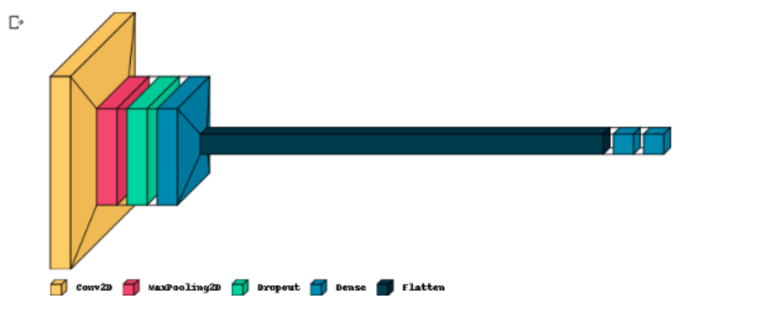
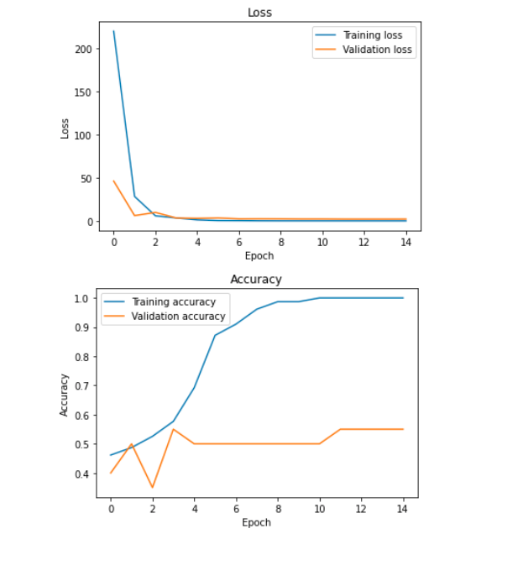
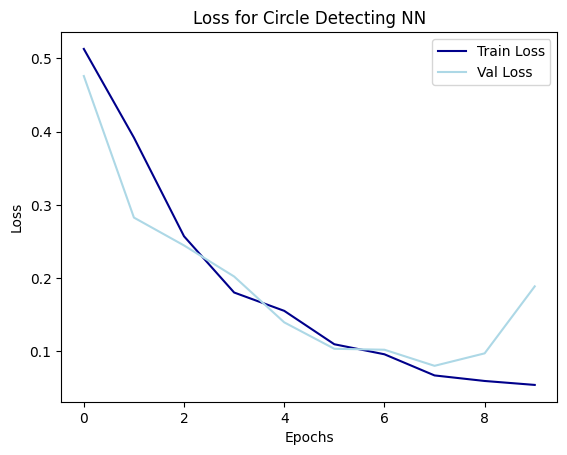
Made new neural networks. They work well! The structure is more simple than the last ones and showing it below with the loss function 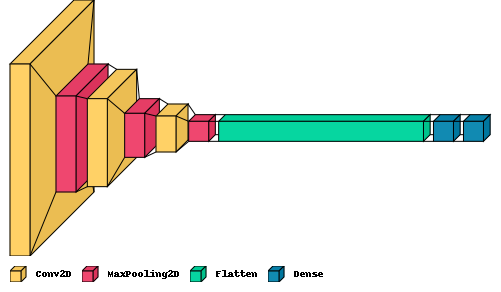
 Started tinkering around with data visualizations and also figured out how to make heatmaps of the filters, but not sure of the best way to analyze them.
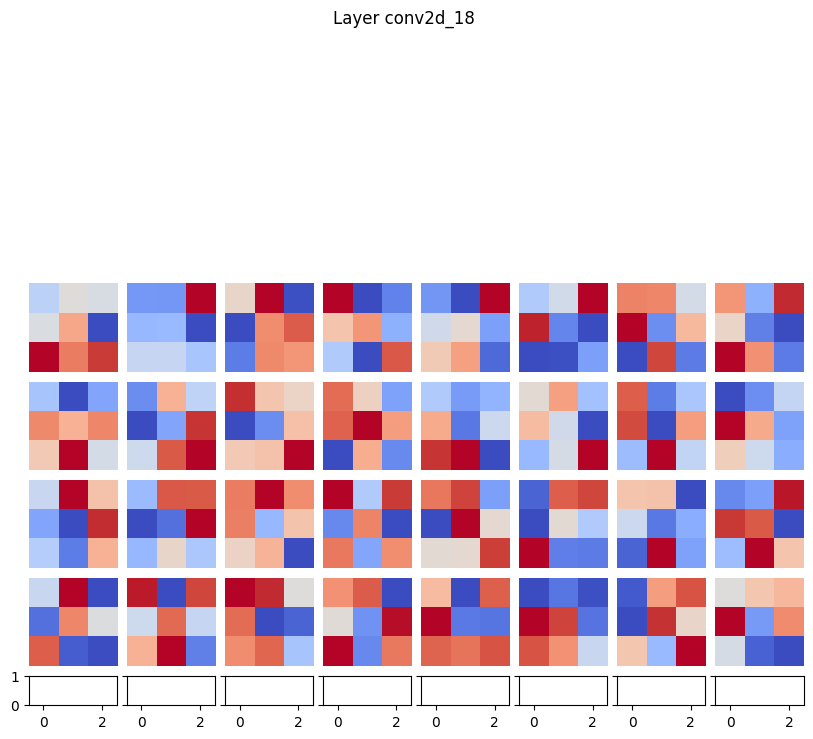
Week 11 Struggling with data visualizations this week. Feel like I have a good hand with the maps of the weights. I’ve been trying to make heatmaps for the activations with images, but struggling with the inputs and what needs to get dot producted with that etc. Theres a lot of papers that explain the general idea but translating it to code has been really difficult.
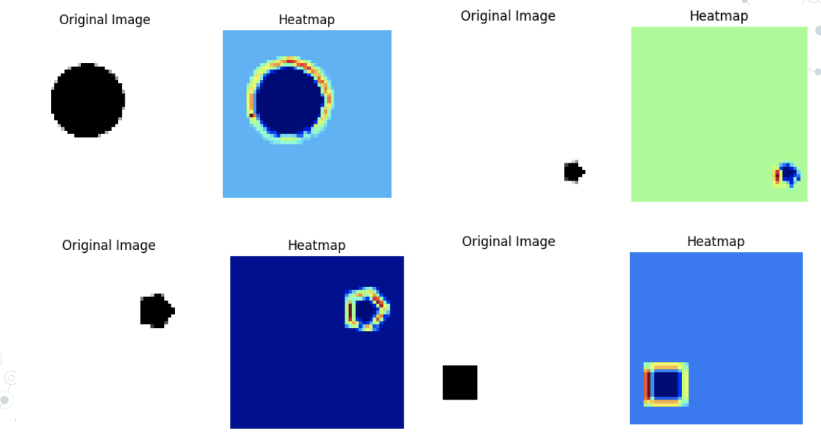
Week 12 I GOT THE HEATMAPS WORKING!! THEY CAME OUT REALLY WELL AND HAD SOME SURPRISING RESULTS! Here is a step by step for generating them for future reference:
A new model is created using tf.keras.models. Model that takes the input tensor and returns both the output of the last convolutional layer and the overall output of the network. This is achieved using last_conv_model = tf.keras.models.Model(model.inputs, [last_conv_layer.output, model.output]). Using a tf.GradientTape context, the gradient of the predicted output with respect to the output of the last convolutional layer is computed. This is accomplished with grads = tape.gradient(loss, conv_output), where loss is the difference between the predicted output and the actual output. The mean of the gradients is taken along each channel using pooled_grads = tf.reduce_mean(grads, axis=(0, 1, 2)). This produces a single gradient score for each channel. The contribution of each channel in the last convolutional layer is calculated by multiplying the feature map of each channel with its corresponding gradient score using heatmap = last_conv_layer_output @ pooled_grads[…, tf.newaxis]. Here, last_conv_layer_output is the output of the last convolutional layer. The tf.squeeze() function is used to remove any singleton dimensions from heatmap, and tf.maximum() is used to apply ReLU activation to the heatmap to remove any negative values. Finally, the heatmap is normalized to have a maximum value of 1 using heatmap /= tf.reduce_max(heatmap).
I also made my presentation for next week
Week 13
I met with Professor Plancher and he sent me an interesting article about loss visualization. It made some concepts I was fuzzy on a bit clearer and was also just super interesting. I gave my presentation in class and it went really well too! Had people asking some neat questions. Focusing this week on getting the paper done for the most part and the last few visualizations
Week TBD