Week 3
This week marked the beginning of the data cleanup process. The image below demonstrates what the raw count matrix looks like, where each invidual cell is given a cellid based on the corresponding DNA sequence, and is associated with a given donor and diagnosis.
Image of Raw Count Matrix
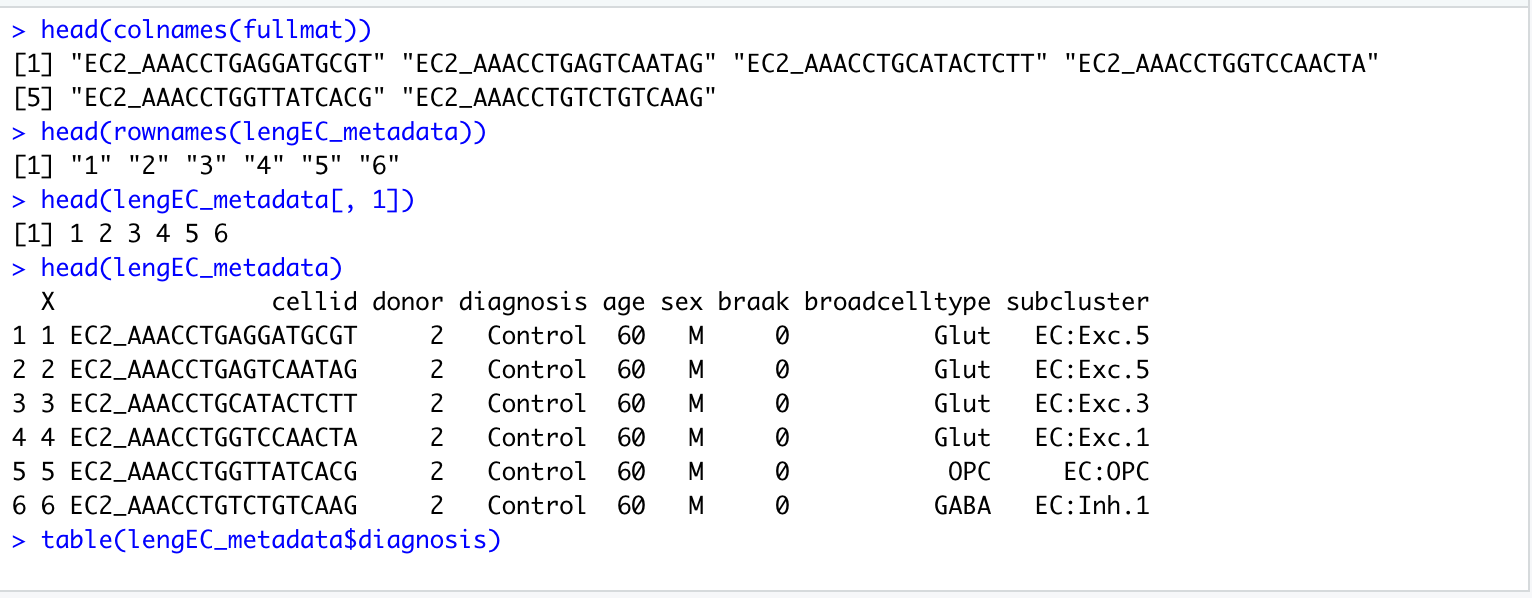
For this project, the main focus will be on the portion of the dataset involving individual’s with Alzheimer’s when compared against those without. In addition to the basic donor information such as age and sex, one of the pieces of information that is provided in the count matrix is braak, which is used as an indicator of severity for both Alzheimer’s and Parkison’s. Each of the cells classified are also assigned a broadcelltype and a subcluster, which are pieces of information that have been obtained from other projects within the lab.
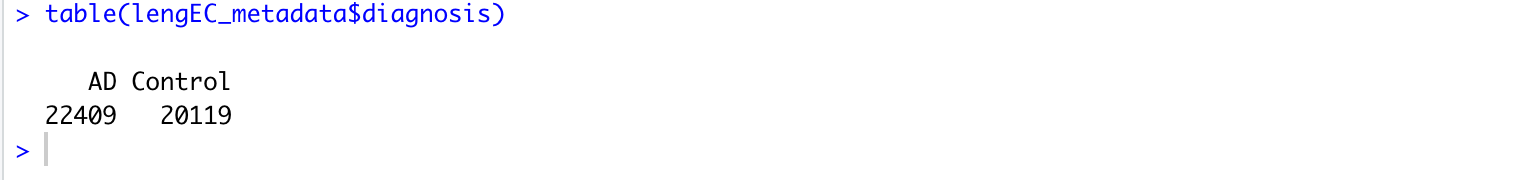
Although the count matrix contains an abundance of information, the main focus of the initial neural net implementation will be on the column labeled ‘diagnosis’. By using this column in addition to the different types of genes, I hope to clean up the data to showcase the genes expressed in individuals with Alzheimer’s, in order to then run the neural net to see potential overlap between donors. One issue that I am likely to run into; however, relates to the size of the dataset. As seen in the image below, the number of entries in the diagnosis column would total to 42528 entries, which my computer may not have the processing power for.
Image Depicting Matrix Size