Week 5
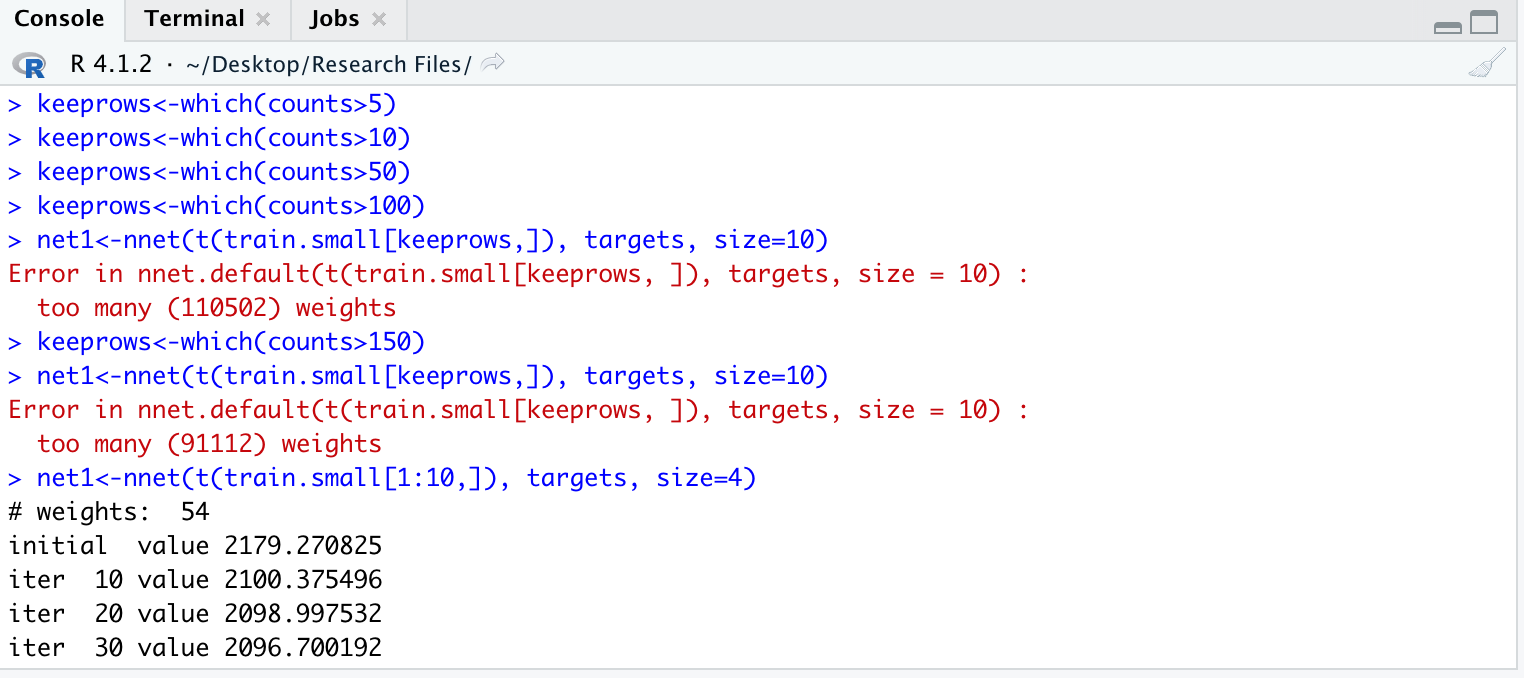
This week I was finally able to implement the neural net for the first time using the nnet package in R, and the output is seen in the image below. Even though I was able to get it to run on small subsections of the data (the test shown below only involved 10 columns of data, so none of the numbers obtained in the output are of significance), I’m still struggling with scaling up to include all of the entires in the cleaned diagnosis data.
Image of Neural Net Execution
The next step involves altering the parameters after trying to scale up the amount of data I’m passing into the neural net. Since I had to create testing and training data myself for the neural net by partitioning the dataset, there are a few routes I can try in order to get the neural net to work properly, all of which are outlined below:
- Alter the percentages of testing and training data (current ratio is 80:20)
- Utilize a computer with higher processing power
- Try running code on lab kernel
- Alter parameters within neural net function (seen in image below)
Image of Neural Net Function
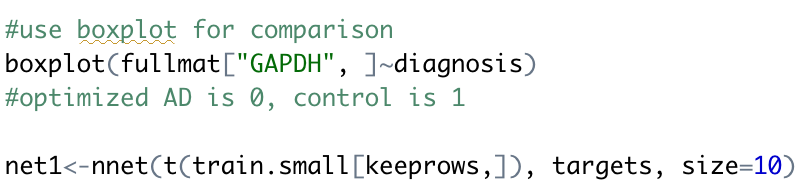
In addition to this, I think that for next week I will also need to do some more research about how to visibly see my results. The output at the top of the page is only providing numbers that I’m unsure of how to interpret, and so far my attempts to use a boxplot to visualize data as seen in the code above have not been successful.