Week 4
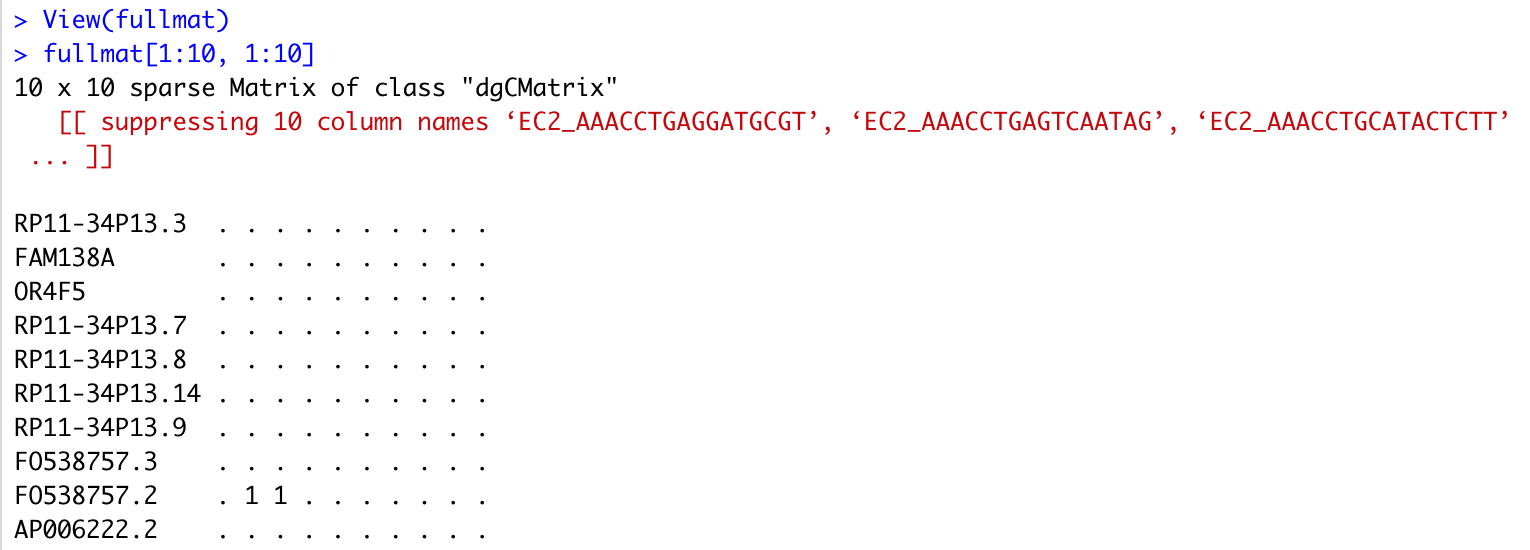
The data was successfully cleaned up, and arranged into the format shown in the following image. The labels on the left hand side represent the individual genes, and each column is labeled with a cellid. The 1’s in the matrix represent instances of individuals containing a positive diagnosis of Alzheimer’s that also represent the given gene being expressed, while columns that contain blank entries are represented using a period. While the image is currently only showing a small subset of the total dataset, this information was obtained for each individual entry in the diagnosis column.
Image of Cleaned Matrix
Separate matrices were saved for each of the variables of interest present in the original count matrix, such as broadcelltype and subcluster. The initial neural net will just be run on the diagnosis column, but I ran into some issues today with using keras. I did some research and found that there are many packages available within R for making neural net models, but if needed I will look into alternative methods or request for pre-labeled data from the lab if need be.