Hypothesis Testing
In this section of my project, I am planning to test whether there was
(1) a statistically significant increase in 311 noise complaint calls during the first three months of the pandemic compared to the same period in 2019, and
(2) a statistically significant decrease in commercial, vehicle, and street/sidewalk noise in these first three months of the pandemic compared to the same period in 2020 and a statistically significant increase in residential noise.
Hypothesis 1
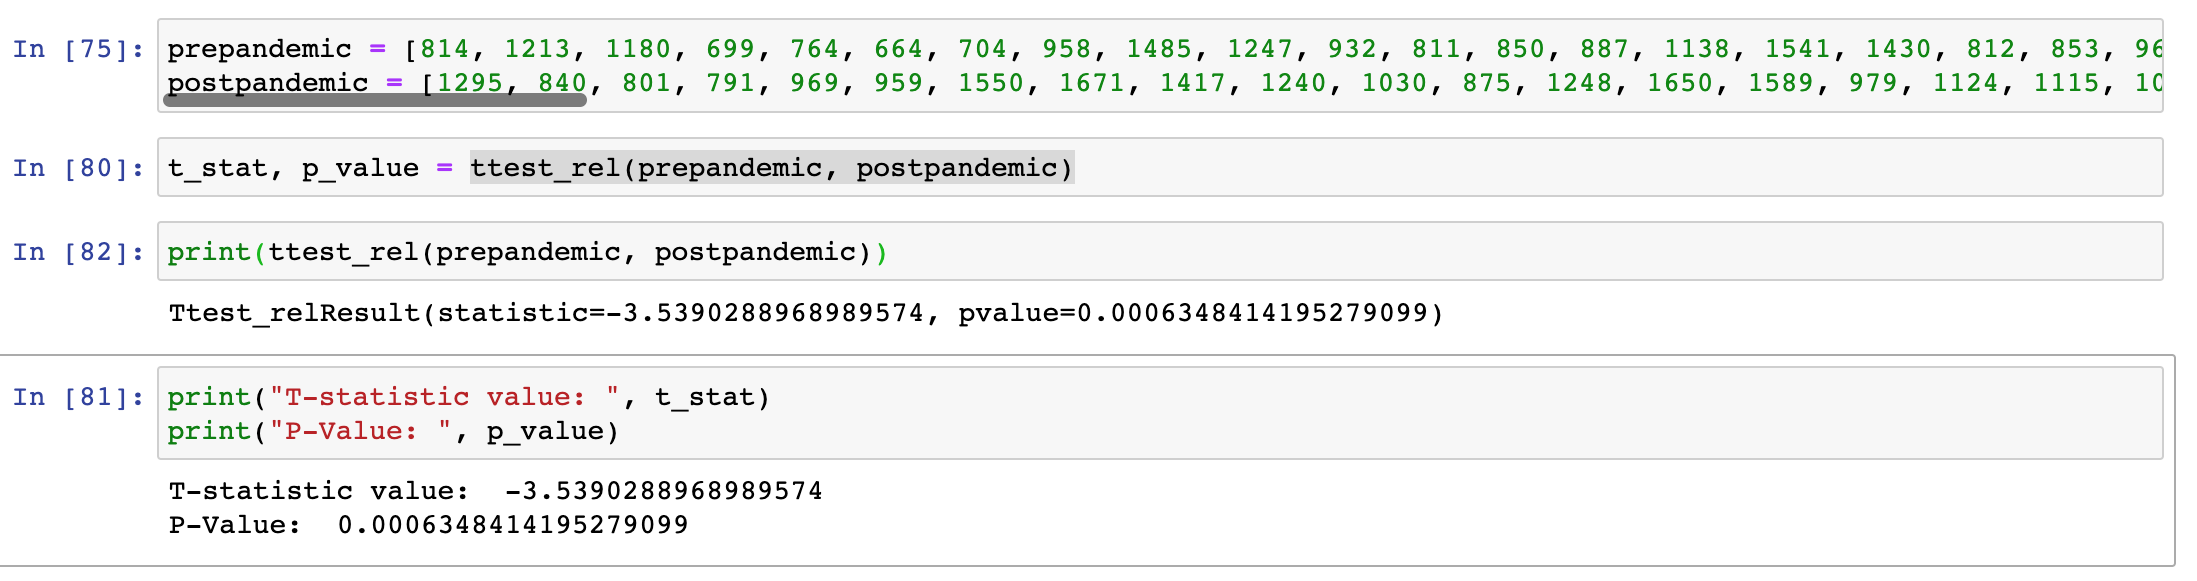
For this hypothesis, I conducted a paired t-test to compare the mean calls per day in the March 1 to May 31, 2019 period against the same period in 2020. A paired t-test is a significance test used when we want to examine the difference between two variables for the same subject, often when separated by time. Because we are examining 311 noise complaints in the same region over two different periods of time, this seemed like a natural fit.
To clean my data, I wrote a function to add a noise complaint date (not just month and year) that excluded time and then aggregated the noise complaints by date. To narrow this down to the specific period, I only looked at dates between 03/01 and 05/31 in the years 2019 and 2020.
Next, I entered the number of calls for each day of each period into two arrays and used the T-Test Rel function in the Scipy Stats library to test these two sets for a statistically significant difference. I found a T-statistic value of -3.539 and a P-Value of 0.0006348, indicating that there is a statistically significant increase in the number of 311 noise complaints during the 2020 period, compared to the same period in 2019.
Hypothesis 2
For my second hypothesis, this would require repeating the same paired T-test process on four different types of noise complaints: commercial, vehicle, street/sidewalk noise, and residential.
Commercial Noise
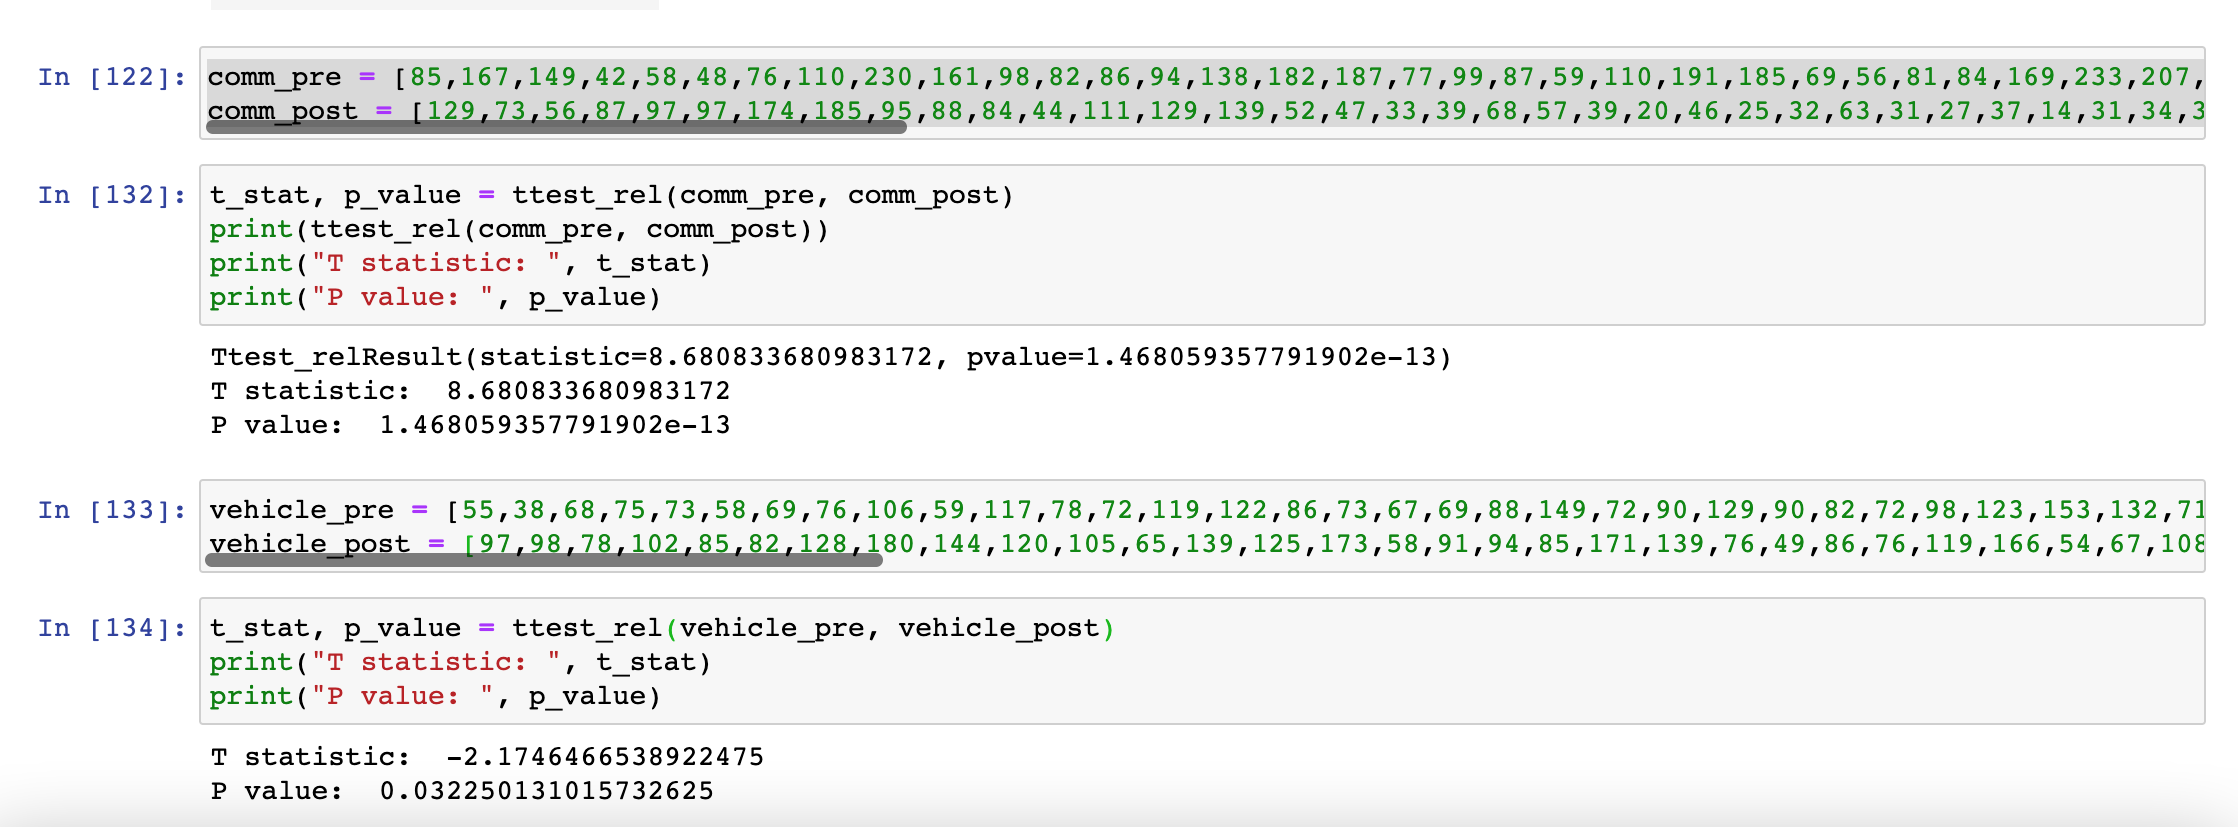
I conducted a paired t-test to compare the mean commercial noise complaints in the March 1 to May 31, 2019 period against the same period in 2020. I found a T statistic of 8.681 and a P value of 1.468e-13 which indicates that there was a statistically significant decrease in the number of 311 commercial noise complaints during the 2020 period.
Vehicle Noise
Next, I conducted a paired t-test to compare the mean vehicle noise complaints in the March 1 to May 31, 2019 period against the 2020 period. I found a T statistic of -2.175 and a P value of .0323 which indicates that there was a statistically significant increase in the number of 311 vehicle noise complaints during the 2020 period.
Street & Sidewalk Noise
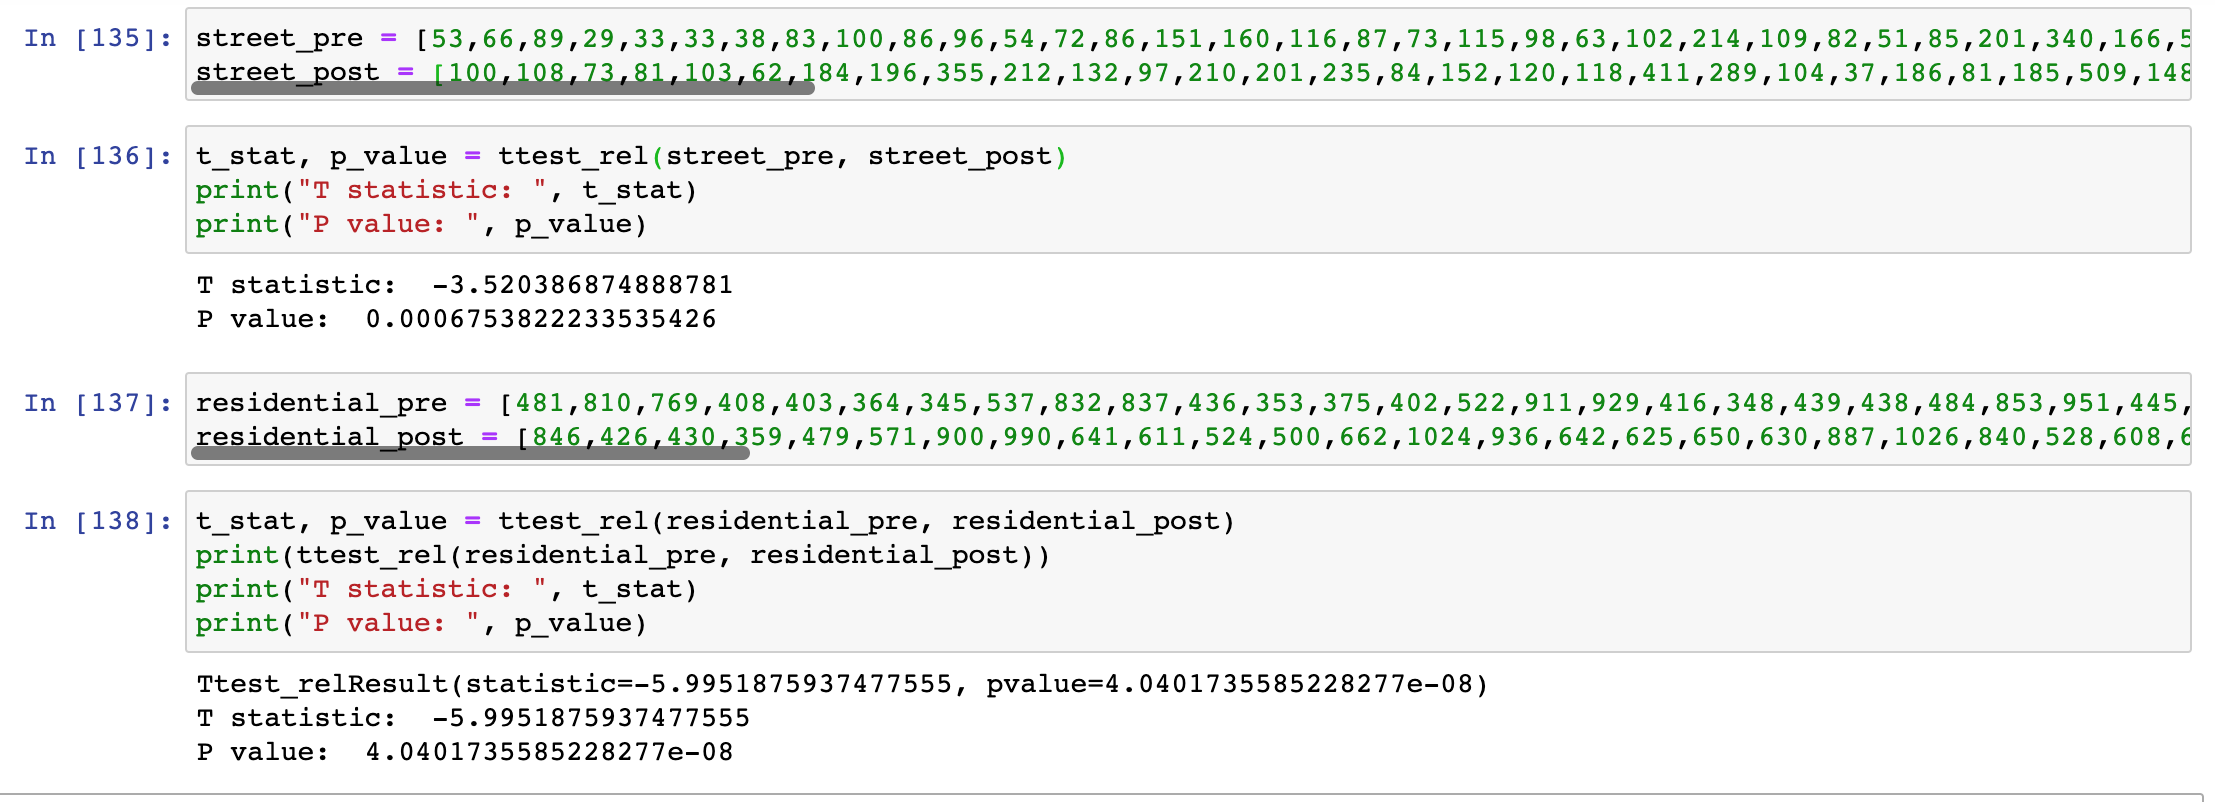
Next, I conducted a paired t-test to compare the mean street/sidewalk noise complaints in the March 1 to May 31, 2019 period against the 2020 period. I found a T statistic of -3.520 and a P value of .000675 which indicates that there was a statistically significant increase in the number of 311 street and sidewalk noise complaints during the 2020 period.
Residential Noise
Finally, I conducted a paired t-test to compare the mean street/sidewalk noise complaints in the March 1 to May 31, 2019 period against the 2020 period. I found a T statistic of -5.995 and a P value of 4.040e-8 which indicates that there was a statistically significant increase in the number of 311 residential noise complaints during the 2020 period.
Here are some screenshots of the Scipy T-Tests I conducted in order to find these results:
Hypothesis 2 Testing Photos
Commercial and Vehicle Noise Complaint Tests
Street/Sidewalk and Residential Noise Complaint Tests
Recap
Just to recap, I found a statistically significant increase in overall noise complaints and residential noise complaints, and a statistically significant decrease in commercial noise complaints. I also found statistically significant increases in vehicle and street/sidewalk noise complaints, which contradicted my hypothesis that there would be a significant decrease in these types of complaints.
Next, I’m planning to use some kind of regression techniques to test my third hypothesis!