Project Week 4
Graph Time
Before jumping straight into the income and neighborhood data, I realized it would be helpful to get counts for the total number of calls by month, year since that’s one of the hypotheses I’m interested in exploring!
I wrote a for loop to parse the Created_Date column in order to return the month + year of a given call in the format XX 20XX and created a new column called Created_MonthYear. If a given call was created on 01/01/2018 12:04:05 AM, the corresponding value in Created_MonthYear for that row would be 01 2018. I could probably do a switch case to reformat with the month (ex: January, instead of 01), but I did not do so yet because I was lazy.
After parsing that info, I created a table that ranked the months with the most calls in descending order, and I also created a chart in MatPlotLib in order to visualize how call frequency changed over the five year period I selected! This graph is pictured below.
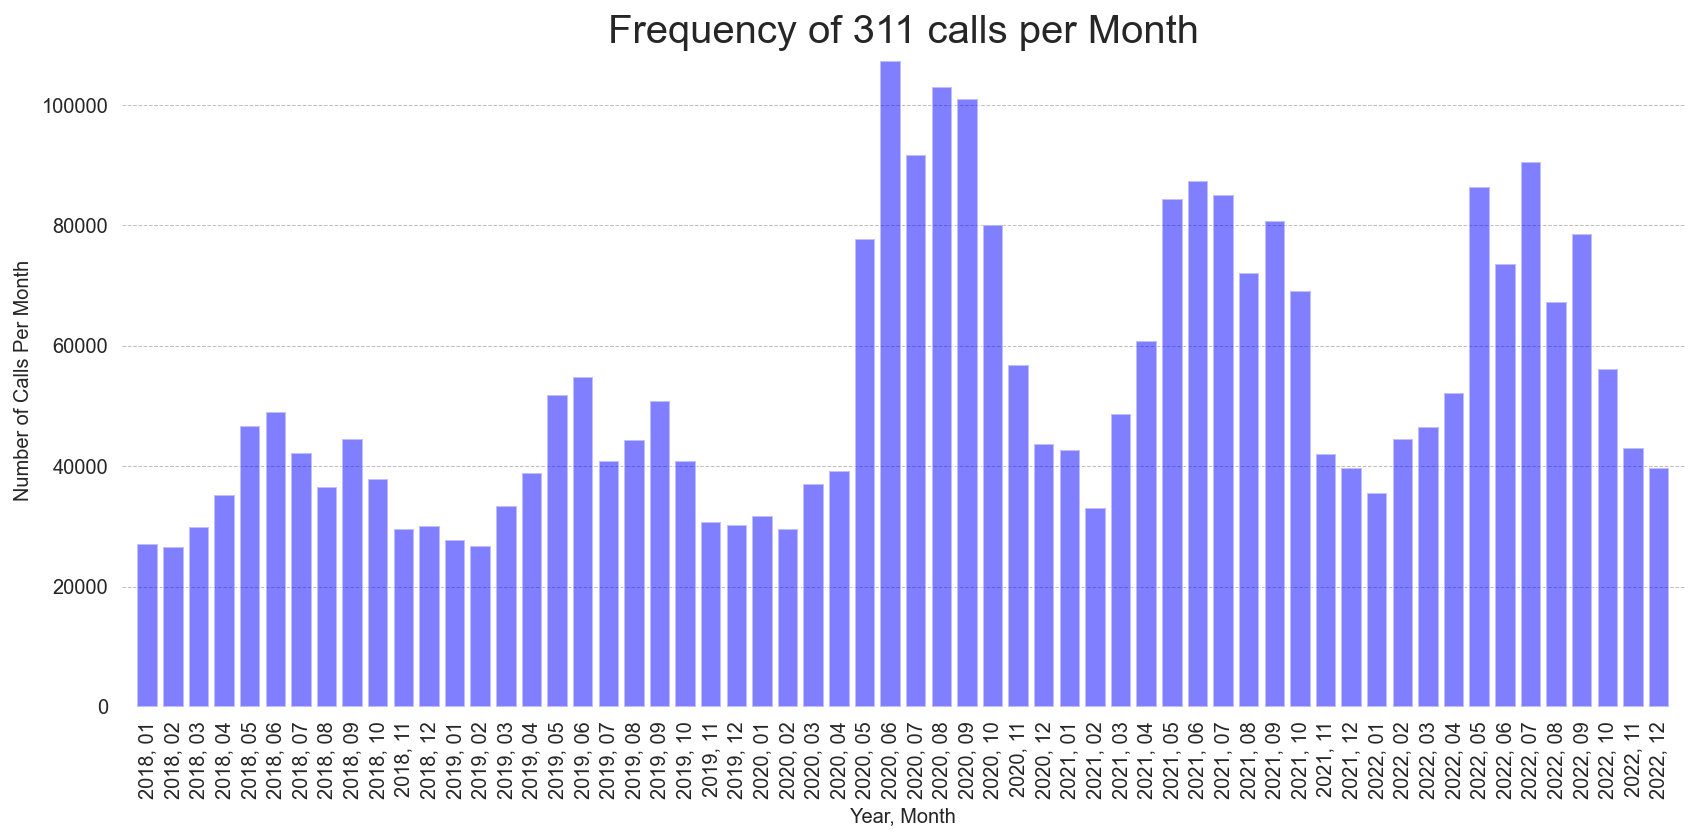
I was actually pretty surprised by this graph. While March and April 2020 call frequency are both relatively similar to levels in 2019, call frequency starts exploding in May 2020 and reaches peak heights in summer of 2020. This call frequency also doesn’t seem to follow normal patterns during COVID in general. Normally, the number of noise complaints peak in the summer and decline in the winter. However, we’re able to see from this graph that call frequency in December 2020 and February 2021 outnumber those in July 2019.
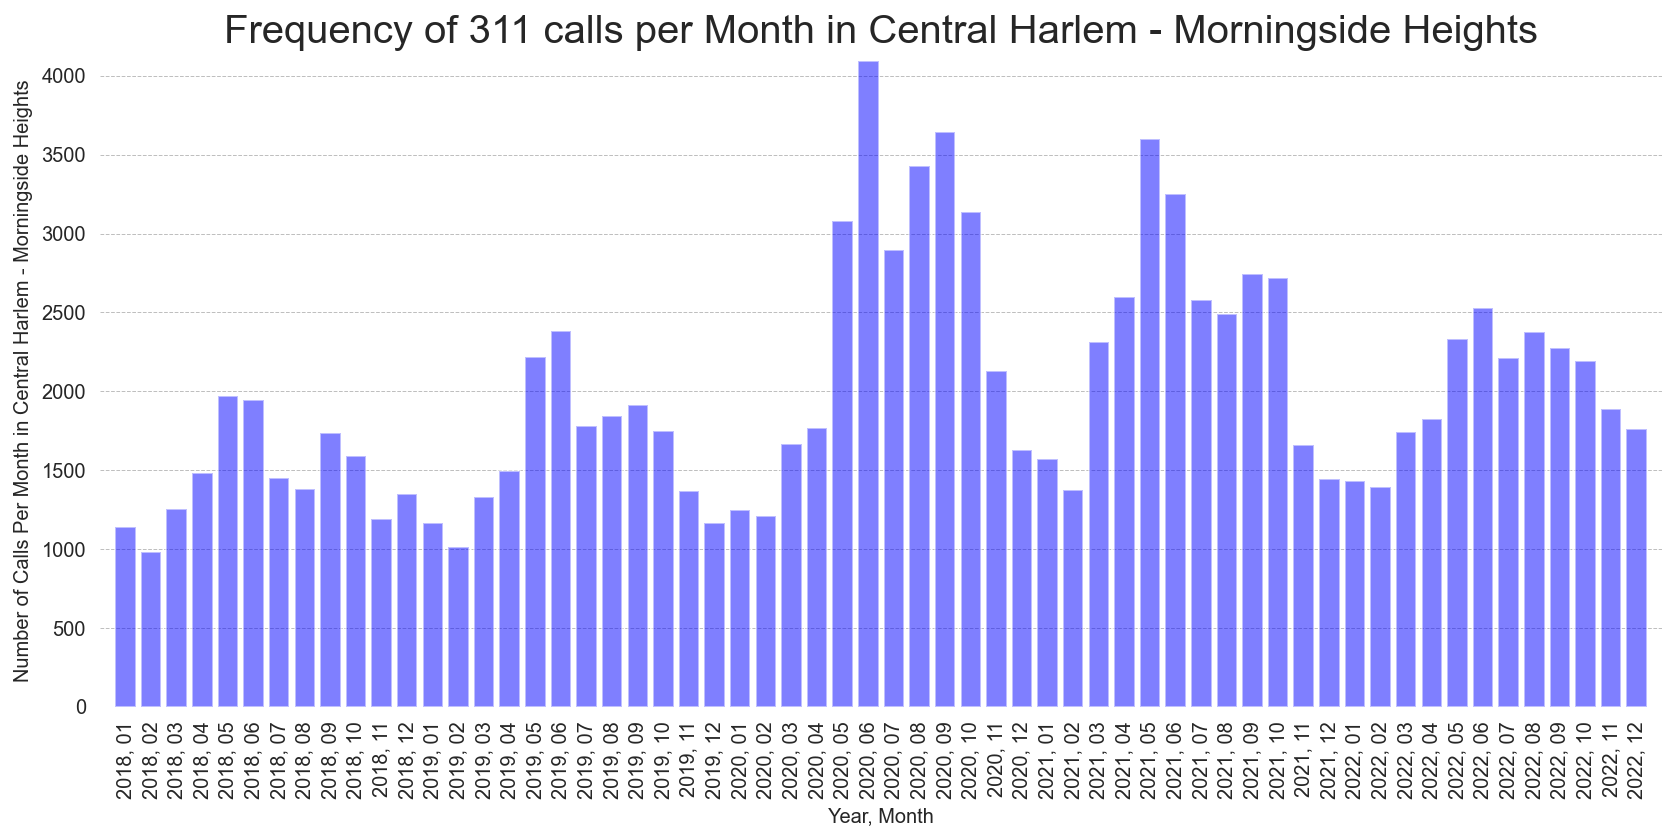
Just to test if I could create chronological call frequency graphs based on neighborhoods (or boroughs, zip codes, etc), I made a similar graph solely based on 311 noise complaint frequency in Central Harlem - Morningside Heights, which is the neighborhood in which Columbia is located.
Hypotheses Testing
(In the words of Billy Joel…you may be wrong, but you may be right.)
I also wanted to tackle some of the hypotheses that I set out to analyze at the start of this project.
Hypothesis 1
First, I had expected that NYC’s 311 Call Center would receive on average more complaints about residential noises in the first three months of the pandemic than the Call Center received in the same period during 2019. I decided to define the first three months of the pandemic as spanning from 03/01/2020 to 5/31/2020. I’ll be comparing the number of noise complaint calls during this period to the number of calls between 03/01/2019 and 05/31/2019.
Note: I might talk to people to decide if this is a reasonable span and if I should consider shifting the start of the pandemic to the day the WHO declared COVID-19 a pandemic. For now, it makes the calculations easier so this span is what I’m going with.
By using the group by and count functions, I was able to get the following values.
Number of 311 noise complaints between 03/01/2019 and 05/31/2019: 33,386 (March ‘19 complaints) + 38,781 (April ‘19 complaints) + 51,866 (May ‘19 complaints) = 124,033 complaints
Number of 311 noise complaints between 03/01/2020 and 05/31/2020: 37,072 (March ‘20 complaints) + 39,267 (April ‘20 complaints) + 77,782 (May ‘20 complaints) = 154,121 complaints
The number of 311 noise complaints is approximately 24% higher in the spring 2020 period than in the spring 2019 period. However, I’ll point out that this difference between time periods did not become dramatic until May 2020, where there were 50% more complaints than in May 2019. If we look at the graph above, this pattern continues throughout the summer where summer 2020 complaint frequencies are much higher than their summer 2019 counterparts.
We can see at face value there’s a pretty noticeable change in complaint frequency between these two periods, but we’ll have to perform some statistical tests in order to verify their significance. I’ll be doing that before spring break ends.
Hypothesis 2
Next, I had expected that the 311 call center will receive on average less complaints about commercial, vehicle, and street/sidewalk noise in these first three months of the pandemic compared to the same period in 2019.
First, we’ll compare the values for commercial noise complaints between 03/01/2019 - 05/31/2019 and 03/01/2020 - 05/31/2020.
Number of commercial noise complaints between 03/01/2019 and 05/31/2019: 3700 (March ‘19 complaints) + 3681 (April ‘19 complaints) + 4758 (May ‘19 complaints) = 12,139 commercial noise complaints
Number of commercial noise complaints between 03/01/2020 and 05/31/2020: 2218 (March ‘20 complaints) + 1071 (April ‘20 complaints) + 2263 (May ‘20 complaints) = 5,615 commercial noise complaints
The number of 311 commercial noise complaints in the spring 2020 period is approximately 46% of the frequency of complaints in the spring 2019 period. We can see that commercial noise complaints (often coming from bars, restaurants and clubs) have been cut by more than half in this time of business closures.
Next, we’ll compare vehicle noise complaints between the two periods.
Number of vehicle noise complaints between 03/01/2019 and 05/31/2019: 2758 (March ‘19 complaints) + 3810 (April ‘19 complaints) + 5334 (May ‘19 complaints) = 11,902 vehicle noise complaints
Number of vehicle noise complaints between 03/01/2020 and 05/31/2020: 3241 (March ‘20 complaints) + 3168 (April ‘20 complaints) + 7657 (May ‘20 complaints) = 14,066 vehicle noise complaints
I was pretty surprised to find that the number of vehicle noise complaints actually increased by 18% from the 2019 period to the 2020 period.
Finally, we’ll compare street/sidewalk noise in the two periods.
Number of street & sidewalk noise complaints between 03/01/2019 and 05/31/2019: 3131 (March ‘19 complaints) + 6617 (April ‘19 complaints) + 11459 (May ‘19 complaints) = 21,207 street and sidewalk noise complaints
Number of street & sidewalk noise complaints between 03/01/2020 and 05/31/2020: 5129 (March ‘20 complaints) + 5491 (April ‘20 complaints) + 7657 (May ‘20 complaints) = 30,570 street and sidewalk noise complaints
Finally, in probably the biggest upset, I was surprised to find that street and sidewalk noise complaints increased by 44% from the 2019 period to the 2020 period. One explanation I have for this is that people were forced to find places outside to congregate which probably led to some fairly noisy outside gatherings.
Based on the histogram shown above, I noticed that the most noticeable changes occurred in the summer months, so I also took the liberty of recalculating all of the above values for the period March 1 to August 31 during 2019 and 2020. 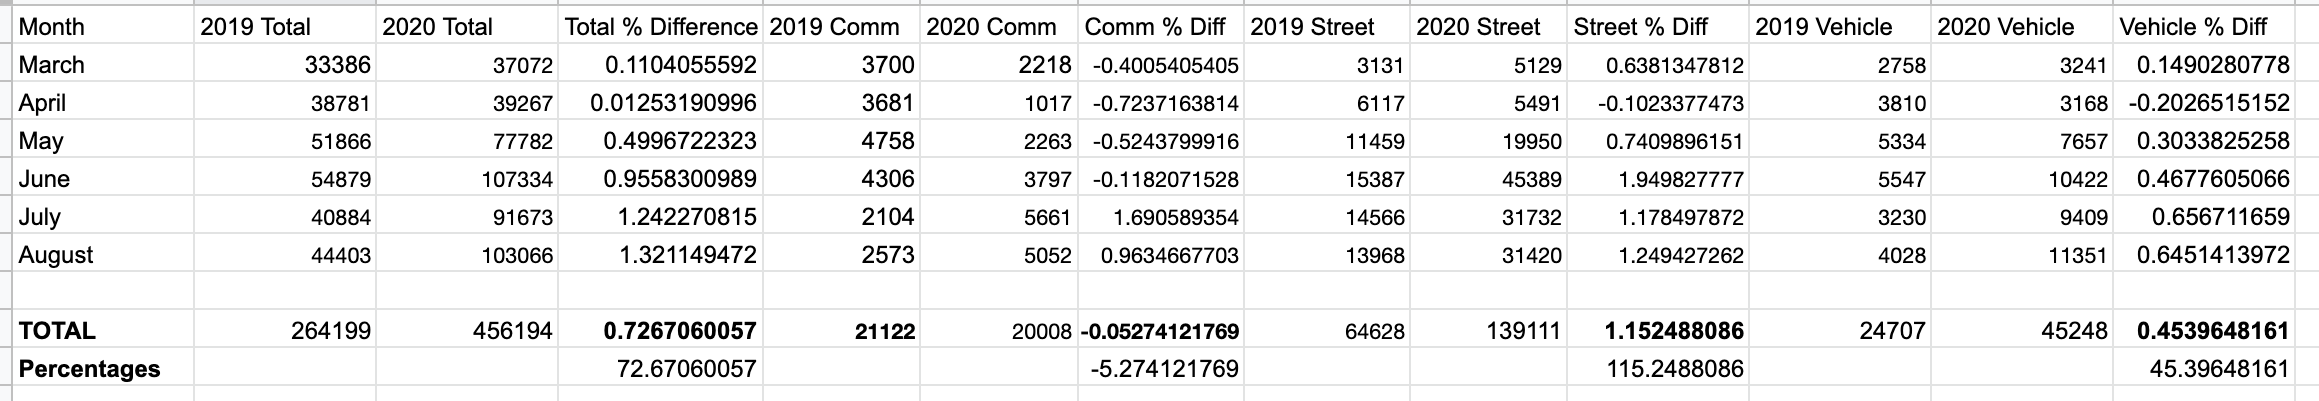
Over the six month period, the commercial complaint levels in 2020 seem much more similar to those in 2019, while street/sidewalk noise complaints exploded during the summer months and vehicle noise complaints were similarly high.
Next, I wanted to calculate differences in noise change across neighborhoods over this six month period in 2019 versus 2020. (I defined these neighborhoods previously using the United Hospital Fund neighborhood index.) Because of the different population sizes for each respective neighborhood, I thought it would be more valuable to measure the percentage difference instead of just calculating the # of 2020 complaints minus the # of 2019 complaints. To accomplish this, I created two new dataframes: one containing noise complaints for March, April, …, August in 2019 and one with complaints for the same period in 2020.
I then aggregated the values by neighborhood for each dataframe in order to establish the number of noise complaints in each neighborhood in each period. To calculate the % change for a given neighborhood, I used the equation (# calls during 2020 - # calls during 2019)/(# calls during 2019).
According to my calculations, the neighborhoods with the largest increases in noise complaints were
- Northeast Bronx, Bronx: 1220% increase in noise complaints (Note: this seems like some weird error?)
- Crotona - Tremont, Bronx: 151% increase
- Washington Heights - Inwood, Manhattan: 107% increase
- High Bridge - Morrisania, Bronx: 101% increase
- East Harlem, Manhattan: 97% increase
- Kingsbridge - Riverdale, Bronx: 93% increase
- Pelham - Throgs Neck, Bronx: 89% increase
- Fordham - Bronx Park, Bronx: 86% increase
- Canarsie - Flatlands, Brooklyn: 80% increase
- Flushing - Clearview, Queens: 79% increase
Meanwhile, the neighborhoods that had decreases (or the smallest increases) in noise complaints were as follows:
- Greenwich Village - SoHo, Manhattan: 25% decrease in noise complaints
- Gramercy Park - Murray Hill, Manhattan: 2.5% decrease
- Lower Manhattan, Manhattan: 1.9% increase
- Chelsea - Hells Kitchen, Manhattan: 3.3% increase
- Upper East Side, Manhattan: 6.0% increase
- Downtown - Heights - Park Slope, Brooklyn: 8.6% increase
- Fresh Meadows, Queens: 9.9% increase
- Stapleton - St. George, Staten Island: 15% increase
- Jamaica, Queens: 15% increase
- Upper West Side, Manhattan - 15% increase in noise
I repeated the same processes with zip codes and found the following zip codes with the largest increases in noise complaints were
- 10466 (Northeast Bronx, Bronx) - 2490% increase (well I guess that’s the source of error I was looking for)
- 10475 (Northeast Bronx, Bronx) - 233% increase
- 10457 (South Bronx, Bronx) - 217% increase
- 10034 (Washington Heights - Inwood, Manhattan) - 184% increase
- 10451 (South Bronx, Bronx) - 181% increase
- 10037 (Central Harlem, Manhattan) - 148% increase
- 10470 (Northeast Bronx, Bronx) - 146% increase
- 11356 (Flushing - Clearview, Queens) - 135% increase
- 11228 (Bay Ridge - Bensonhurst, Brooklyn) - 134% increase
- 10040 (Washington Heights - Inwood, Manhattan) - 129% increase
Meanwhile, the following zip codes had the largest decreases in noise complaints:
- 11432 (Jamaica, Queens) - 37% decrease in noise complaints
- 10017 (Gramercy Park - Murray Hill, Manhattan) - 34% decrease
- 10022 (Gramercy Park - Murray Hill, Manhattan) - 33% decrease
- 10005 (Lower Manhattan, Manhattan) - 32% decrease
- 10013 (Greenwich Village - SoHo, Manhattan) - 29% decrease
- 10014 (Greenwich Village - SoHo, Manhattan) - 24% decrease
- 10023 (Upper West Side, Manhattan) - 23% decrease
- 10012 (Greenwich Village - SoHo, Manhattan) - 21% decrease
- 10004 (Lower Manhattan, Manhattan) - 21% decrease
- 10011 (Chelsea - Hell’s Kitchen, Manhattan) - 19% decrease