More Temporal Analysis
Hours of Day
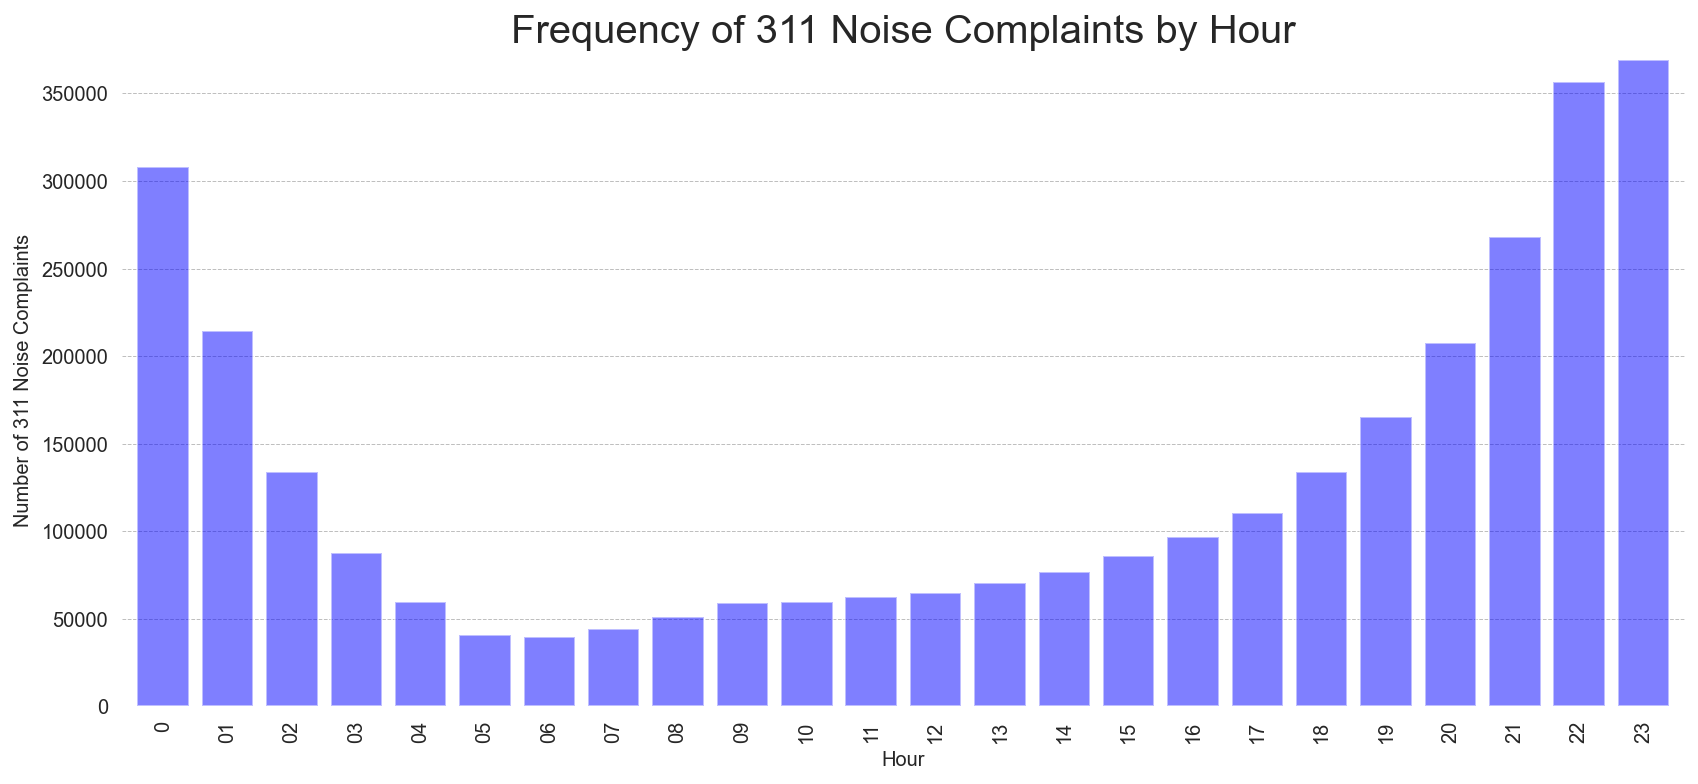
Somehow I forgot to measure noise complaint frequency by hour of the day, so I took care of that quickly. I made a new function to slice the ‘Created_Date’ column in order to get the hour, and I first made a graph in MatPlotLib to display the frequency of 311 noise complaints by hour of the day in the entire dataframe range (January 1 2018 to December 31 2022). Not that surprisingly, calls were most frequent during 11 PM, 10 PM, and midnight respectively.
Next, I wanted to compare how call frequency changed at different hours of day during the start of the pandemic. To accomplish this, I decided to experiment with having two tables’ frequencies available on the same chart to make it easier for anyone looking at it to quickly compare. The chart below displays the differences in call frequencies by hour of day from March 1 to May 31, comparing 2019’s numbers to 2020’s. This GeeksForGeeks guide ended up being quite helpful for accomplishing this.
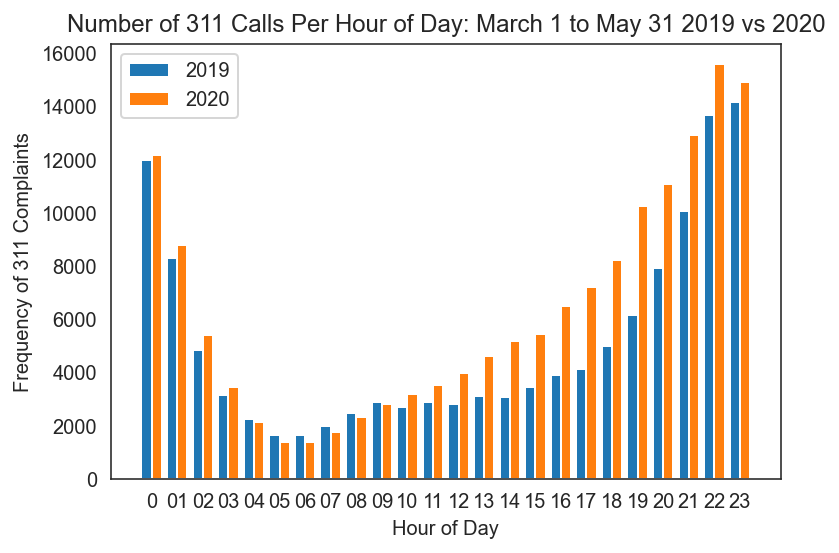
Comparing 2020’s numbers to those of 2019’s, I was interested to find that for 18/24 hours of the day, 2020’s number of 311 noise complaints surpassed those of 2019—2020’s numbers were lower only from 4 am to 9 am. This trend of increased noise complaints was especially noticeable between 12 pm and 10 pm where noise complaint frequency soared past their pre-pandemic levels. I would hypothesize that due to the increase of people working from home and remaining home in the evening hours, they were more likely to experience noise disruptions they otherwise would not have encountered when working in the office. This graph demonstrates how noise complaint levels did not increase uniformly, but rather shifted in their distribution toward the afternoon and evening as opposed to late nights.
I was interested to see if this trend continued into 2021, so I created another graph depicting the noise frequencies for hours of the day in the same March 1 to May 31 period, but this time comparing numbers from 2020 to those in 2021.
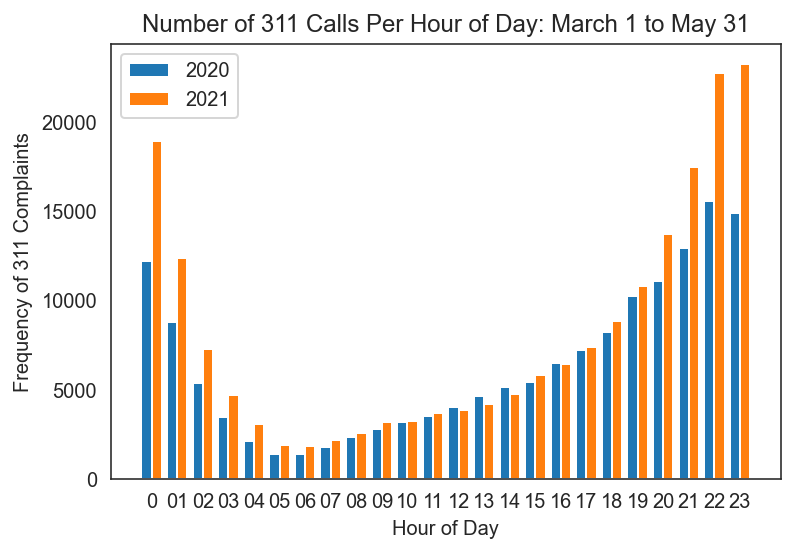
While most of the daytime hours frequency counts stayed quite similar between 2020 and 2021, 311 noise complaints exploded during the nighttime from 9pm to 1am. This could indicate that while some people began to return to normal social life, others remained inside and were stuck with the surrounding noise. This graph also does not demonstrate any “return to normal” in terms of noise levels—20/24 hours of the day saw increases in noise complaints from 2020 to 2021. While the sheltering-in-place phase of the pandemic was declining, there was no subsequent reduction in noise levels.
Days of Week
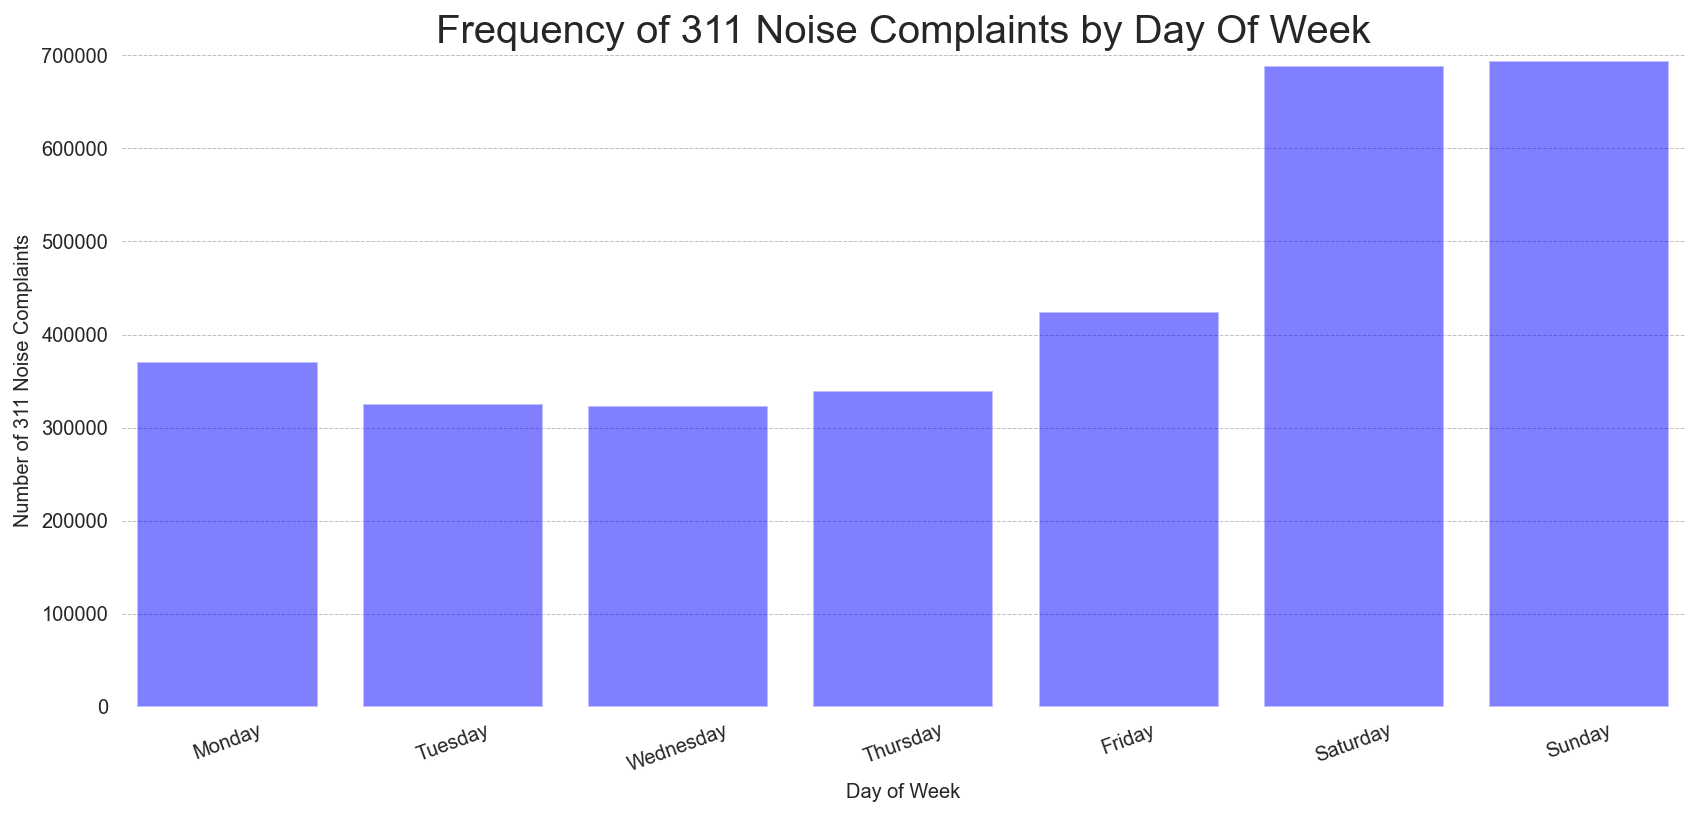
I also wanted to check out noise complaints by hour of the day, so I used the datetime library to convert my date strings into datetime objects and convert the datetime into a day of the week. I then plotted this in MatPlotLib (I finally learned how to change the x axis labels!)
Similar to my hours of day graphing, I wanted to be able to compare changes in 311 noise complaint frequency across days of the week from pre-pandemic time to pandemic time. I performed the same process of graphing the two frequencies side by side, in a less clustered manner this time thankfully.
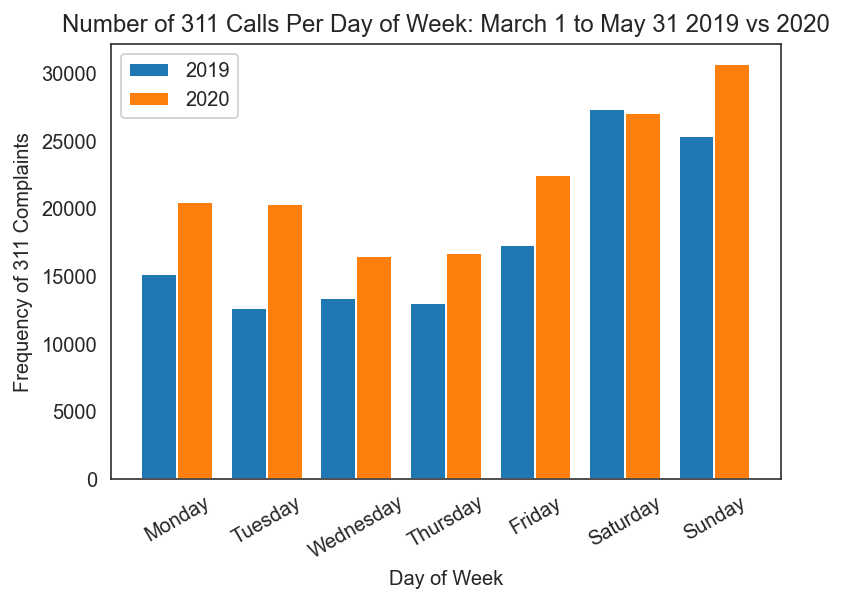
In this graph, it’s interesting to see that the most pronounced changes in noise complaints occurred on weekdays—the largest increases occurred on Monday and Tuesday, with Friday and Sunday following. The only date with similar levels of noise complaints was on Saturday, the day of the week with the second most noise complaints during the week throughout the entire dataset according to the first days of the week chart I presented. The changes presented in this graph echo the similar changes in the hours of the day one, where we see changes in the distribution of noise increase away from their typical patterns.
Out of curiosity, I wanted to determine whether this pattern persisted one year after the beginning of the pandemic, so I repeated this process adding a bar to the graph to depict the March 1 to May 31 timespan in the year 2021. By this point, many NYC residents were still working from home, but restrictions were easing as more people were able to leave their homes to go to restaurants, parks, museums, and other traditional sources of entertainment outside of the home.
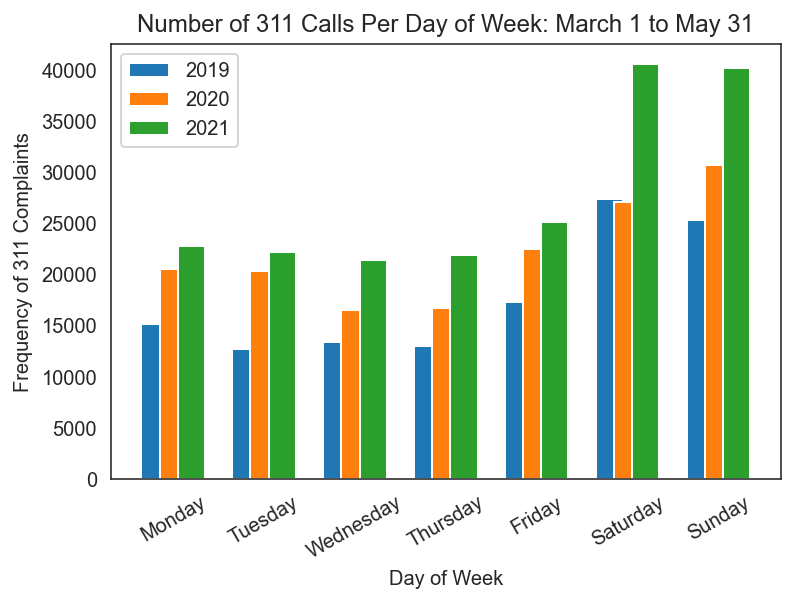
The changes in distributions get even more interesting when examining this chart. While 2020’s call frequencies showed a shift to increasing noise complaints on weekdays, 2021’s numbers depict similarly high complaints on weekdays to 2020 (increasing sharply in some places) but exploding on weekends. Additionally, there appears to be no visible decrease in noise complaints from 2020, suggesting that this trend is not going anywhere soon.