Project Week 2
Research Questions and Hypotheses
In my research, I’m interested in assessing how noise complaints shifted in New York City during the pandemic and in comparison to pre-pandemic periods.
- I believe that NYC’s 311 Call Center received on average more complaints about residential noises in the first three months of the pandemic than the Call Center received in the same period during 2019.
- Meanwhile, I believe the call center will receive on average less complaints about commercial, vehicle, and street/sidewalk noise in these first three months compared to the same period in 2019.
- During this three month period, I believe that low-income zip codes will be more likely to experience and report monthly noise complaints on average compared to medium-to-high-income zip codes.
I plan to source this data on low-income vs medium- and high-income zip codes using Census data on median household income by zip code.
In addition to checking out some of these hypotheses, I want to use this dataset as a starting point to tackling some different big data problems. For example, I think it could be really cool to do some prediction of type of noise complaint you’d likely experience in a given zip code at a given time of day. It could also be very cool to do some data visualizations of how call frequency varies over time. I’m still brainstorming things, but exploring this dataset has me excited for this project!
Preliminary Data Analysis
In addition to brainstorming research questions, I’ve also been performing some preliminary analysis on my dataset to clean it up and get a sense of the most common complaints. I referenced the Jupyter notebook of a similar project on 311 Data to help guide me when cleaning this dataset.
I started with cleaning my dataset. My data file was taken from the NYC Open Data database for 311 calls, and it is filtered to include only complaints whose Complaint Type mentions Noise, and between dates 1 January 2018 and 31 December 2022. Next, I loaded it into Python and dropped all irrelevant columns from the dataset so that all that remained were “Created Date”, “Closed Date”, “Complaint Type”, “Descriptor”, “Incident Zip”, “Borough”, “Latitude”, “Longitude”, and “Location”. Next, I removed any rows with N/A info. This cleaning left me with 3,165,366 rows and 9 columns.
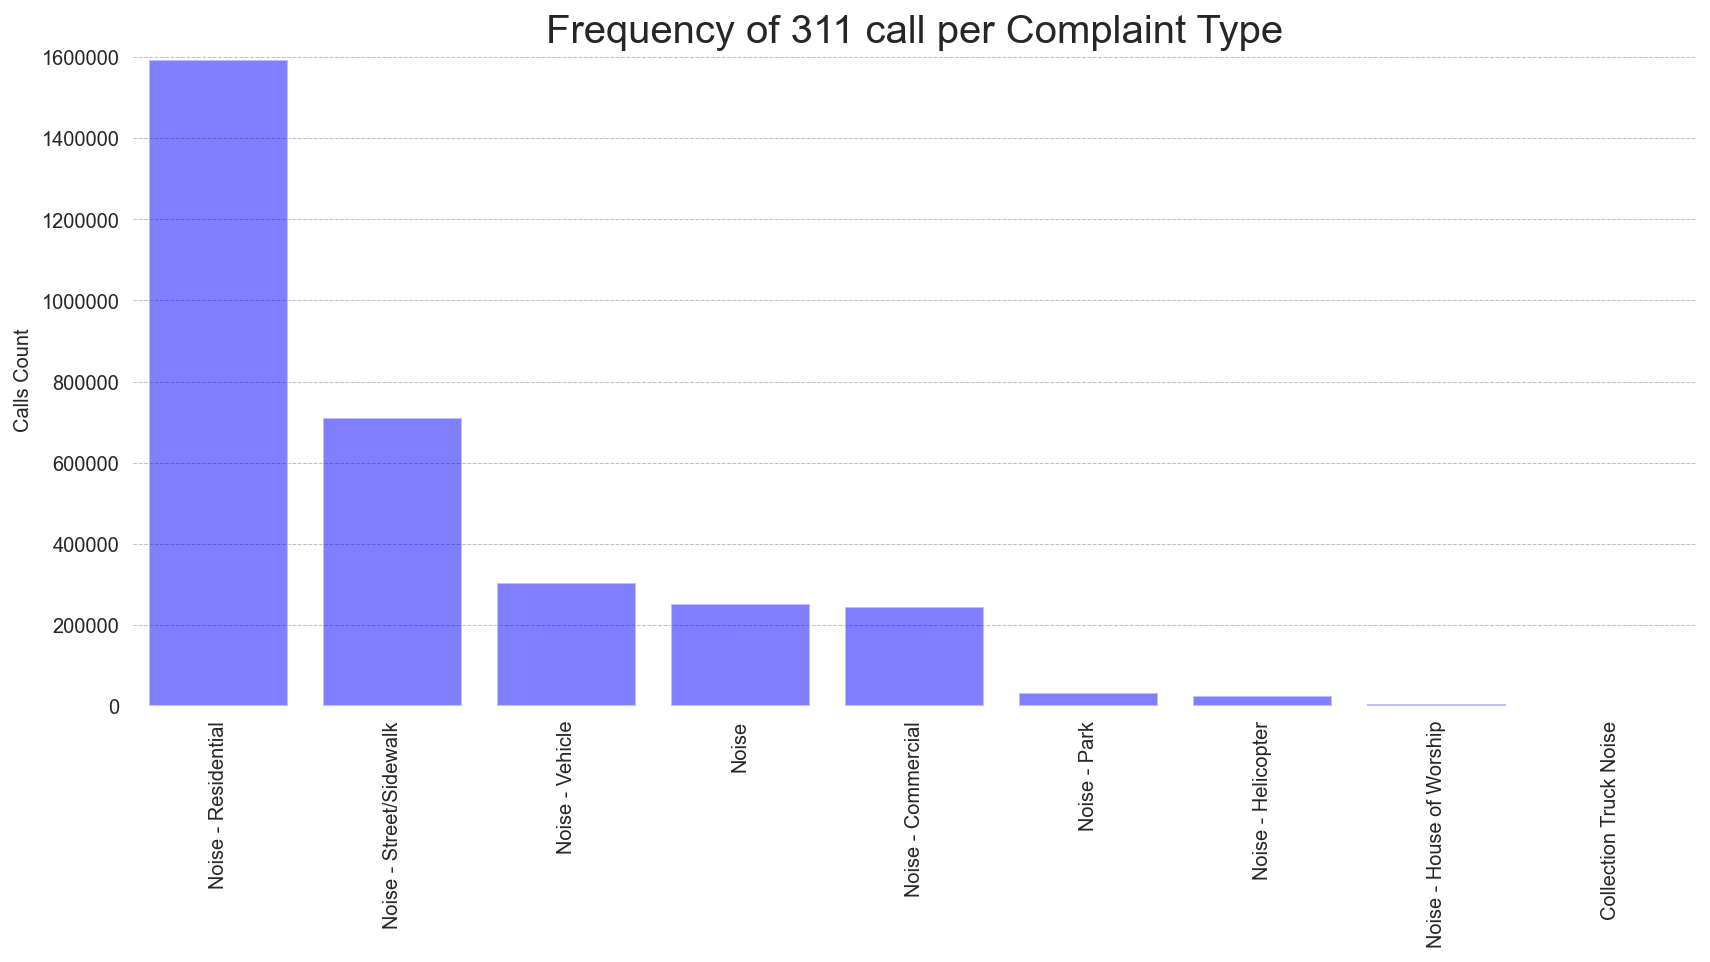
Next, I wanted to grab the unique categories for Complaint Type and Descriptor, just to get a general sense of the types of complaints. In this dataset, there were 9 unique complaint type categories that were reported with the following frequency (in most to least order):
Most Common Noise Complaint Types
- Noise - Residential: 1,592,072 complaints
- Noise - Street/Sidewalk: 710,176 complaints
- Noise - Vehicle: 304,518 complaints
- Noise: 251,083 complaints
- Noise - Commercial: 243,525 complaints
- Noise - Park: 32,608 complaints
- Noise - Helicopter: 24,838 complaints
- Noise - House of Worship: 5,819 complaints
- Collection Truck Noise: 727 complaints
Below is a simple graph to visualize these complaint frequencies.
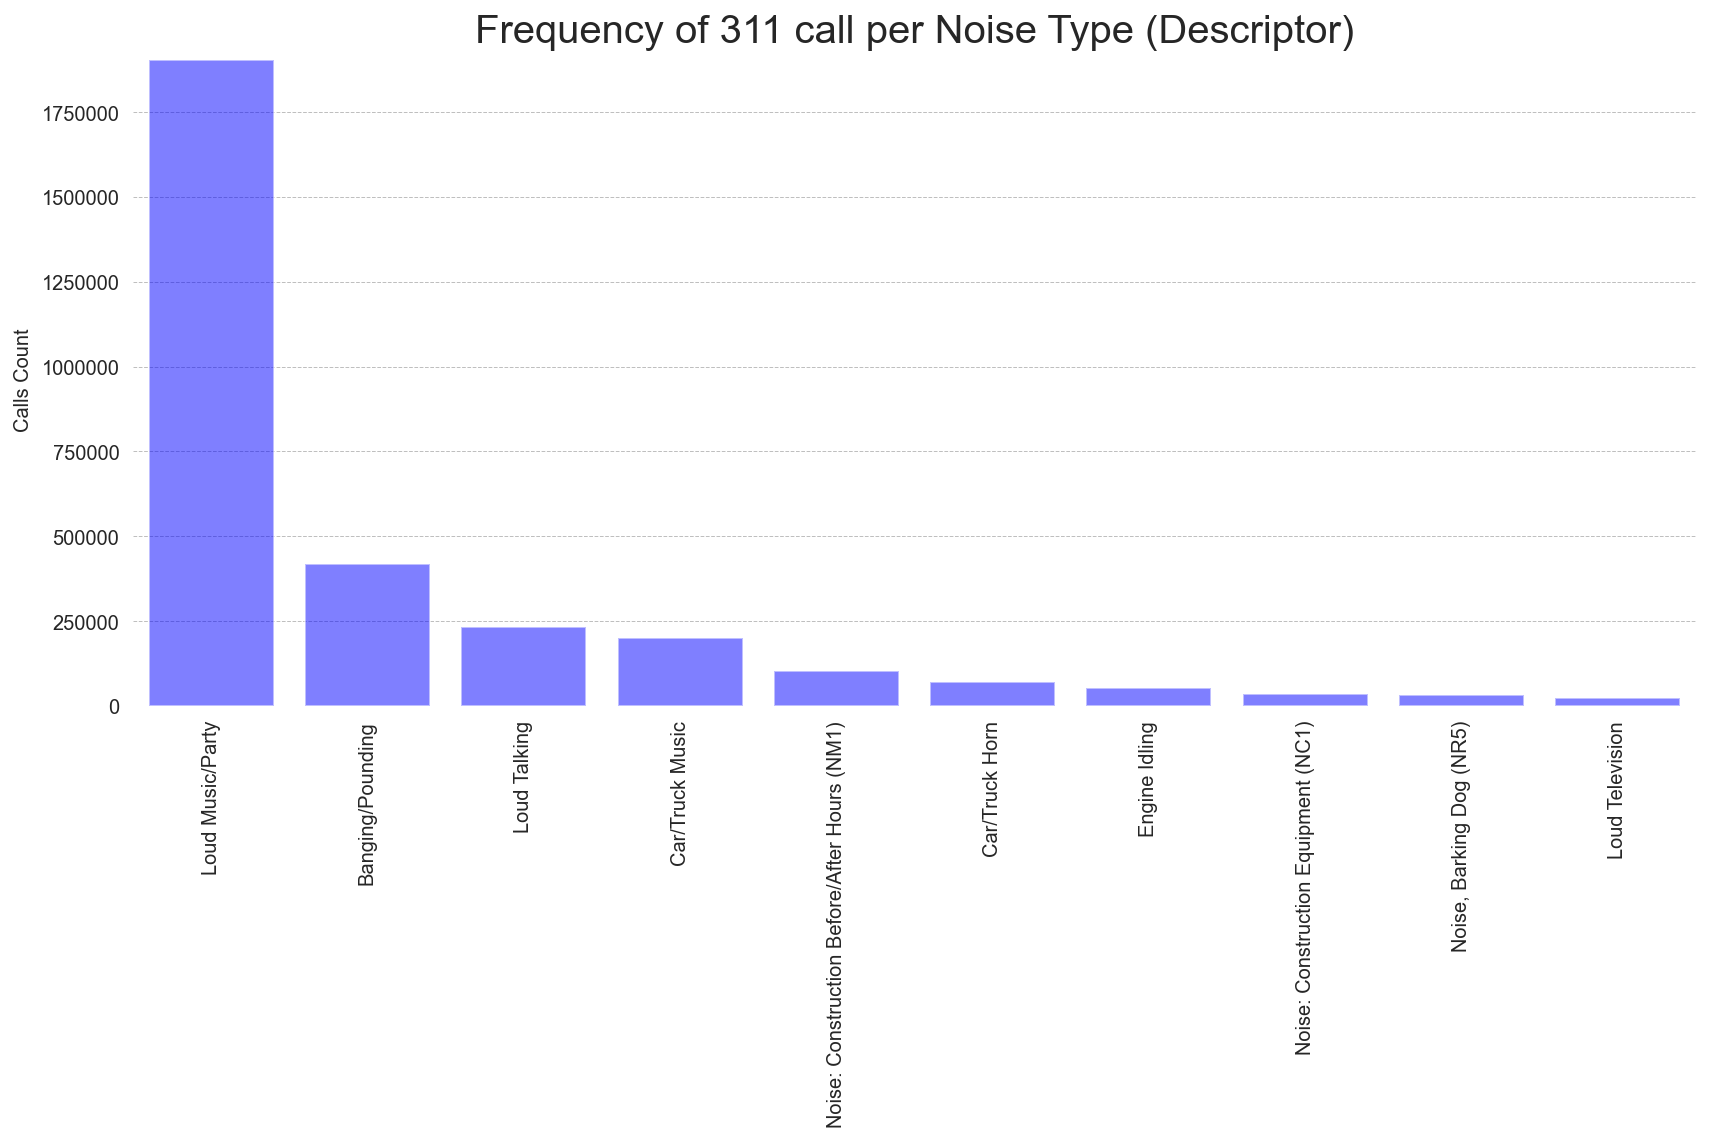
Meanwhile, the top 10 complaint descriptions were as follows. My favorite new tidbit is that noise from ice cream trucks are the 14th most common complaint.
Top 10 Noise Complaint Descriptions
- Loud Music/Party: 1,897,101 complaints
- Banging/Pounding: 415,402 complaints
- Loud Talking: 231,375 complaints
- Car/Truck Music: 198,569 complaints
- Noise: Construction Before/After Hours (NM1): 104,255 complaints
- Car/Truck Horn: 70,321 complaints
- Engine Idling: 51,310 complaints
- Noise: Construction Equipment (NC1): 36,235 complaints
- Noise, Barking Dog (NR5): 31,385 complaints
- Loud Television: 24,640 complaints
Here’s another simple graph to visualize specific noise description frequencies.
Finally, I want to share some quick stats on the number of noise-related calls received over the period January 1 2018 to December 31, 2022. Here is some quick info on the stats surrounding noise-related calls in those years.
- January 1 to Dec 31, 2018: 435,244 calls
- January 1 to Dec 31, 2019: 471,402 calls
- January 1 to Dec 31, 2020: 798,989 calls
- January 1 to Dec 31, 2021: 745,739 calls
- January 1 to Dec 31, 2022: 713,992 calls
We can start to see that noise-related complaints increased by 70% from 2019 to 2020. I’m excited to keep exploring this data and see what else can be found in the coming weeks!