Hypothesis Testing Part 2
In this section of my project, I am planning to test whether income levels in a particular zip code affected the percentage of change in the amount of 311 noise complaints from the 2019 period to the 2020 period.
I’m planning to try using linear regression which I have not used before, but it seems like a good fit to determine this relationship between two continuous variables, using average zip code income (sourced earlier from Census data) as my independent variable and the % change in noise as my dependent variable. I am looking at percentage change in noise complaints in order to control for different population amounts in different zip codes.
First, I want to note that I ended up removing 10466’s data from this test because I found it to be a statistical outlier that would negatively skew the results of this linear regression test. The percentage change in noise complaints for 10466 was more than 3 standard deviations from the mean, so I was able to remove it.
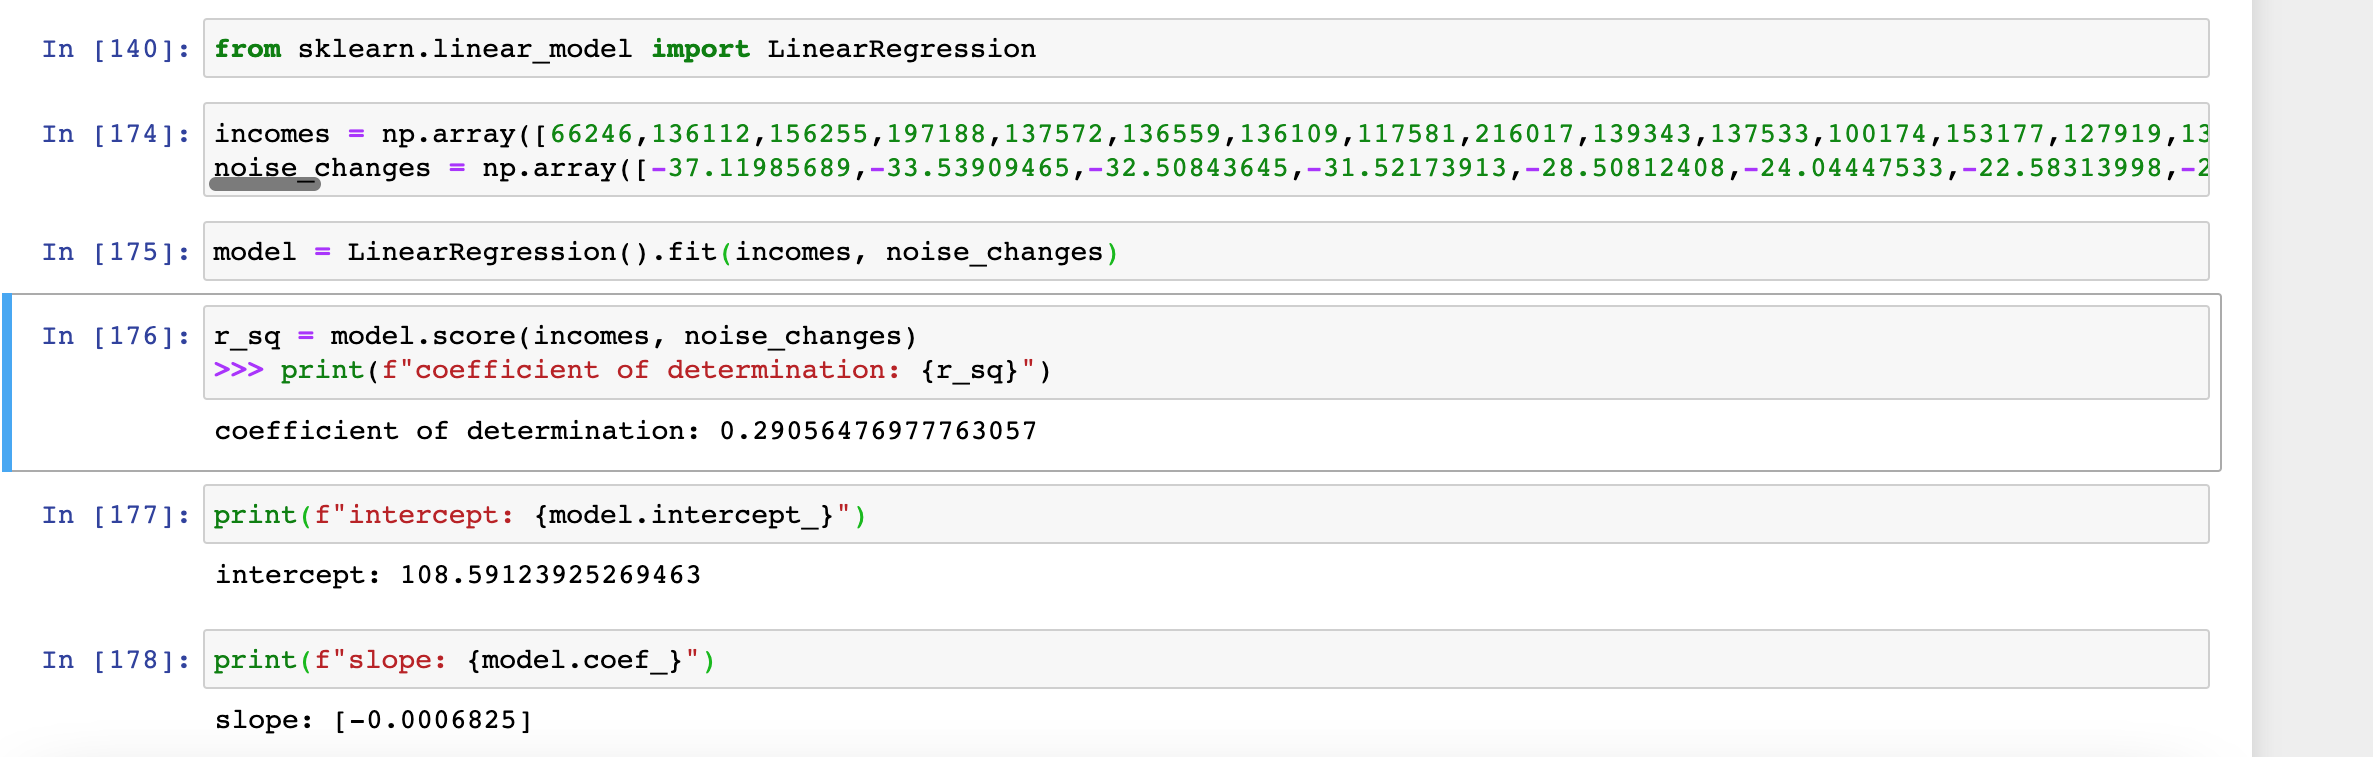
In Python, I used the Scipy linear regression model to test my hypothesis, using this guide to help me carry out this testing. I set my input variable as my list of incomes, and my response variable as my list of corresponding percentage changes in noise complaints between March 1 to May 31 in 2020 vs 2019. Next, I created a linear regression model and fitted it with my independent and dependent variable lists. Finally, I got my results to check the R-squared value, and to get my intercept and slope for the linear regression.
When I fitted my model, I found there was an R-squared value of 0.291. Although this would be classified as a weak R-squared value (.25 < .291 < .50), human behavior is relatively difficult to predict, so this value may be more meaningful than it initially reveals. According to the definition of R-squared as a statistical measure, we have found that approximately 29% of the observed variation in percentage change of noise complaints in a zip code can be explained by the zip code’s income. Considering all the other factors that might be at play here, this R-squared value feels like a fairly satisfactory result.
Additionally, I found that my linear regression model had an intercept of 108.591 and a slope of -0.0006825.
Linear Regression Test Results
Just for fun, I also decided to input a range of incomes to the model just to see what the predicted changes of noise levels would turn out to be:
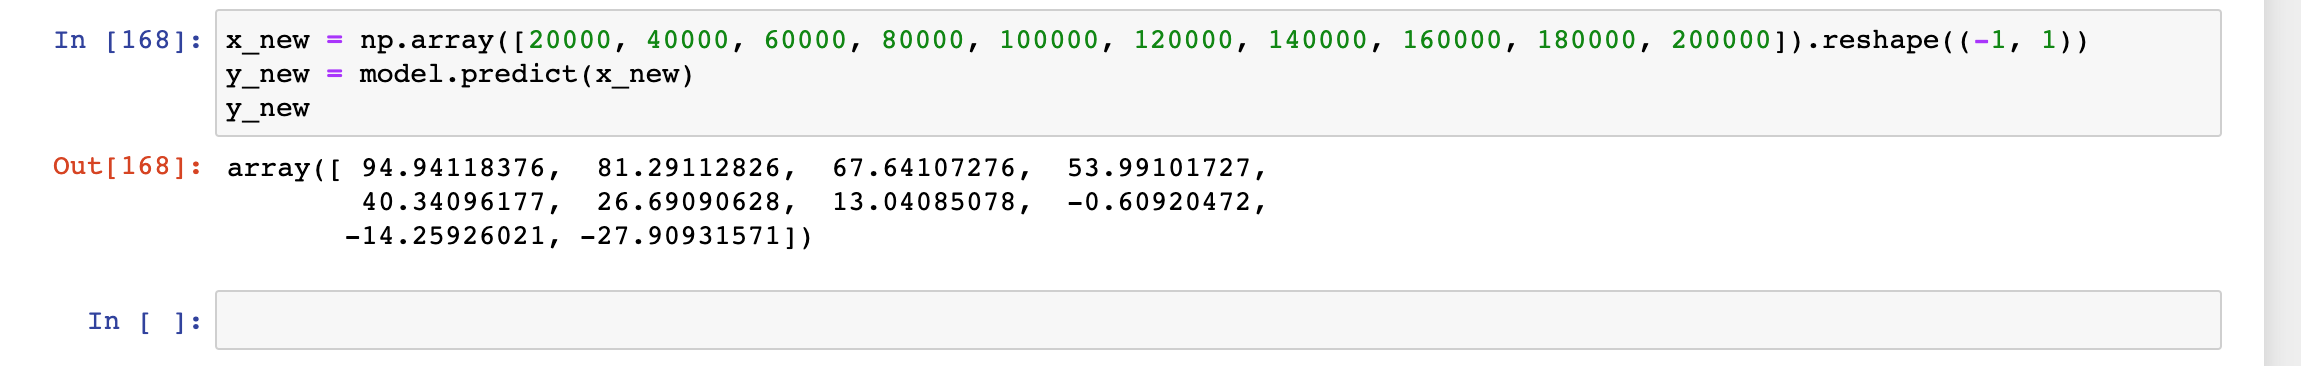
As we can see from the results, the model nicely captures the inverse relationship between income and % change in noise level.
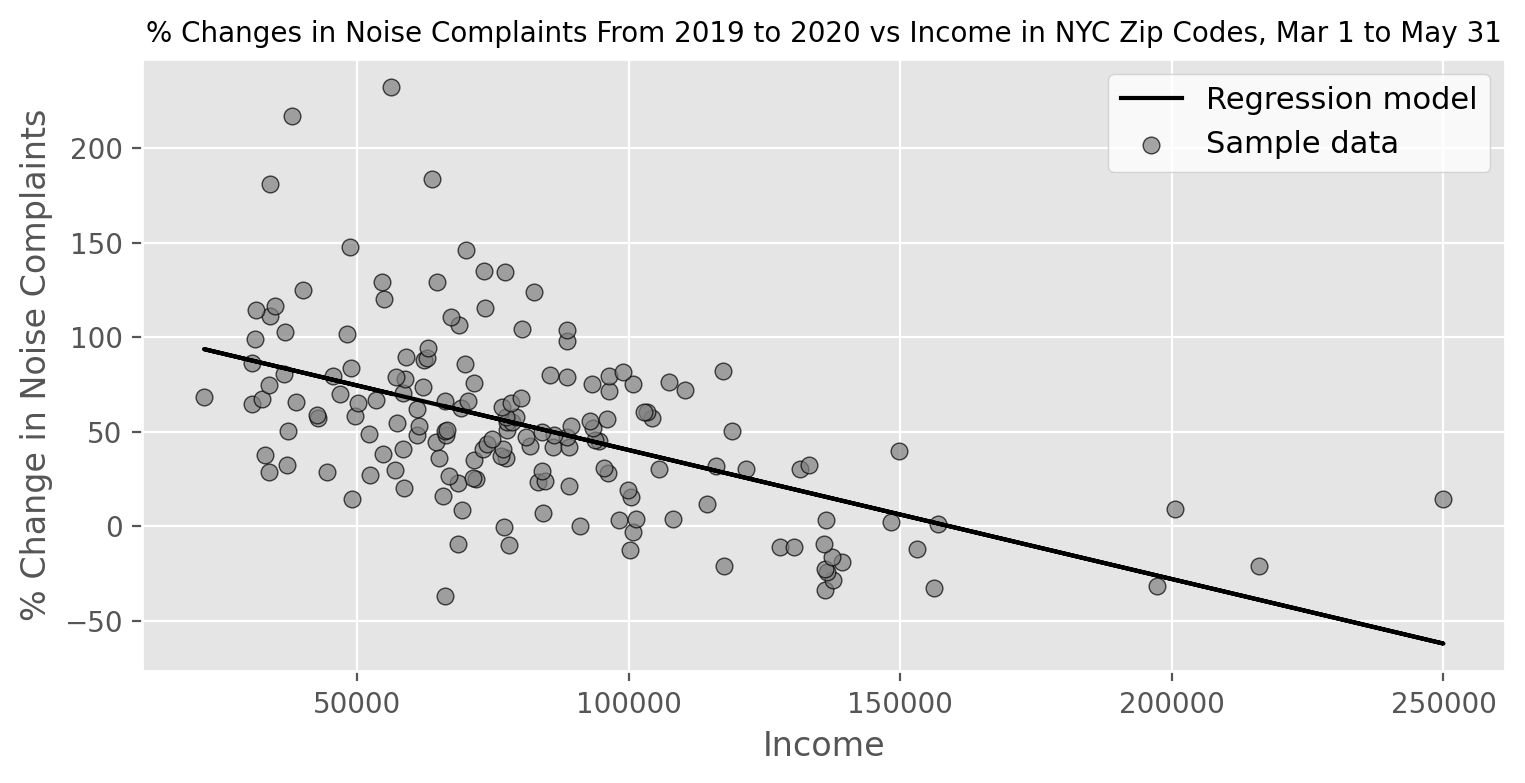
Linear Regression Visualization
I wanted people interested to be able to see the actual relationship between income and % changes in noise complaint frequency during the beginning of the pandemic so I utilized sk_learn’s linear model in order to graph this relationship in MatPlotLib. The solid line is the regression model’s predicted relationship between the independent and dependent variable. As you can see, there are definitely variance that makes it far from a linear relationship, but it is interesting to see the loose connection between the two variables.