Project Week 3
This week, I wanted to continue some preprocessing by adding neighborhood information to each row in the database and doing some stats on neighborhood/zip code data.
Adding Neighborhood Info
First off, my existing database included zip code values, but I wanted to also add a column for neighborhood names in order to give users some more context, since most people can’t identify many zip codes off the top of their head. To link zip codes to neighborhood names, I used this neighborhood index doc from the NYC government United Hospital Fund codes which connects zip codes to neighborhood names. A lot of this isn’t exact, but I think it’s helpful to have context for these places.
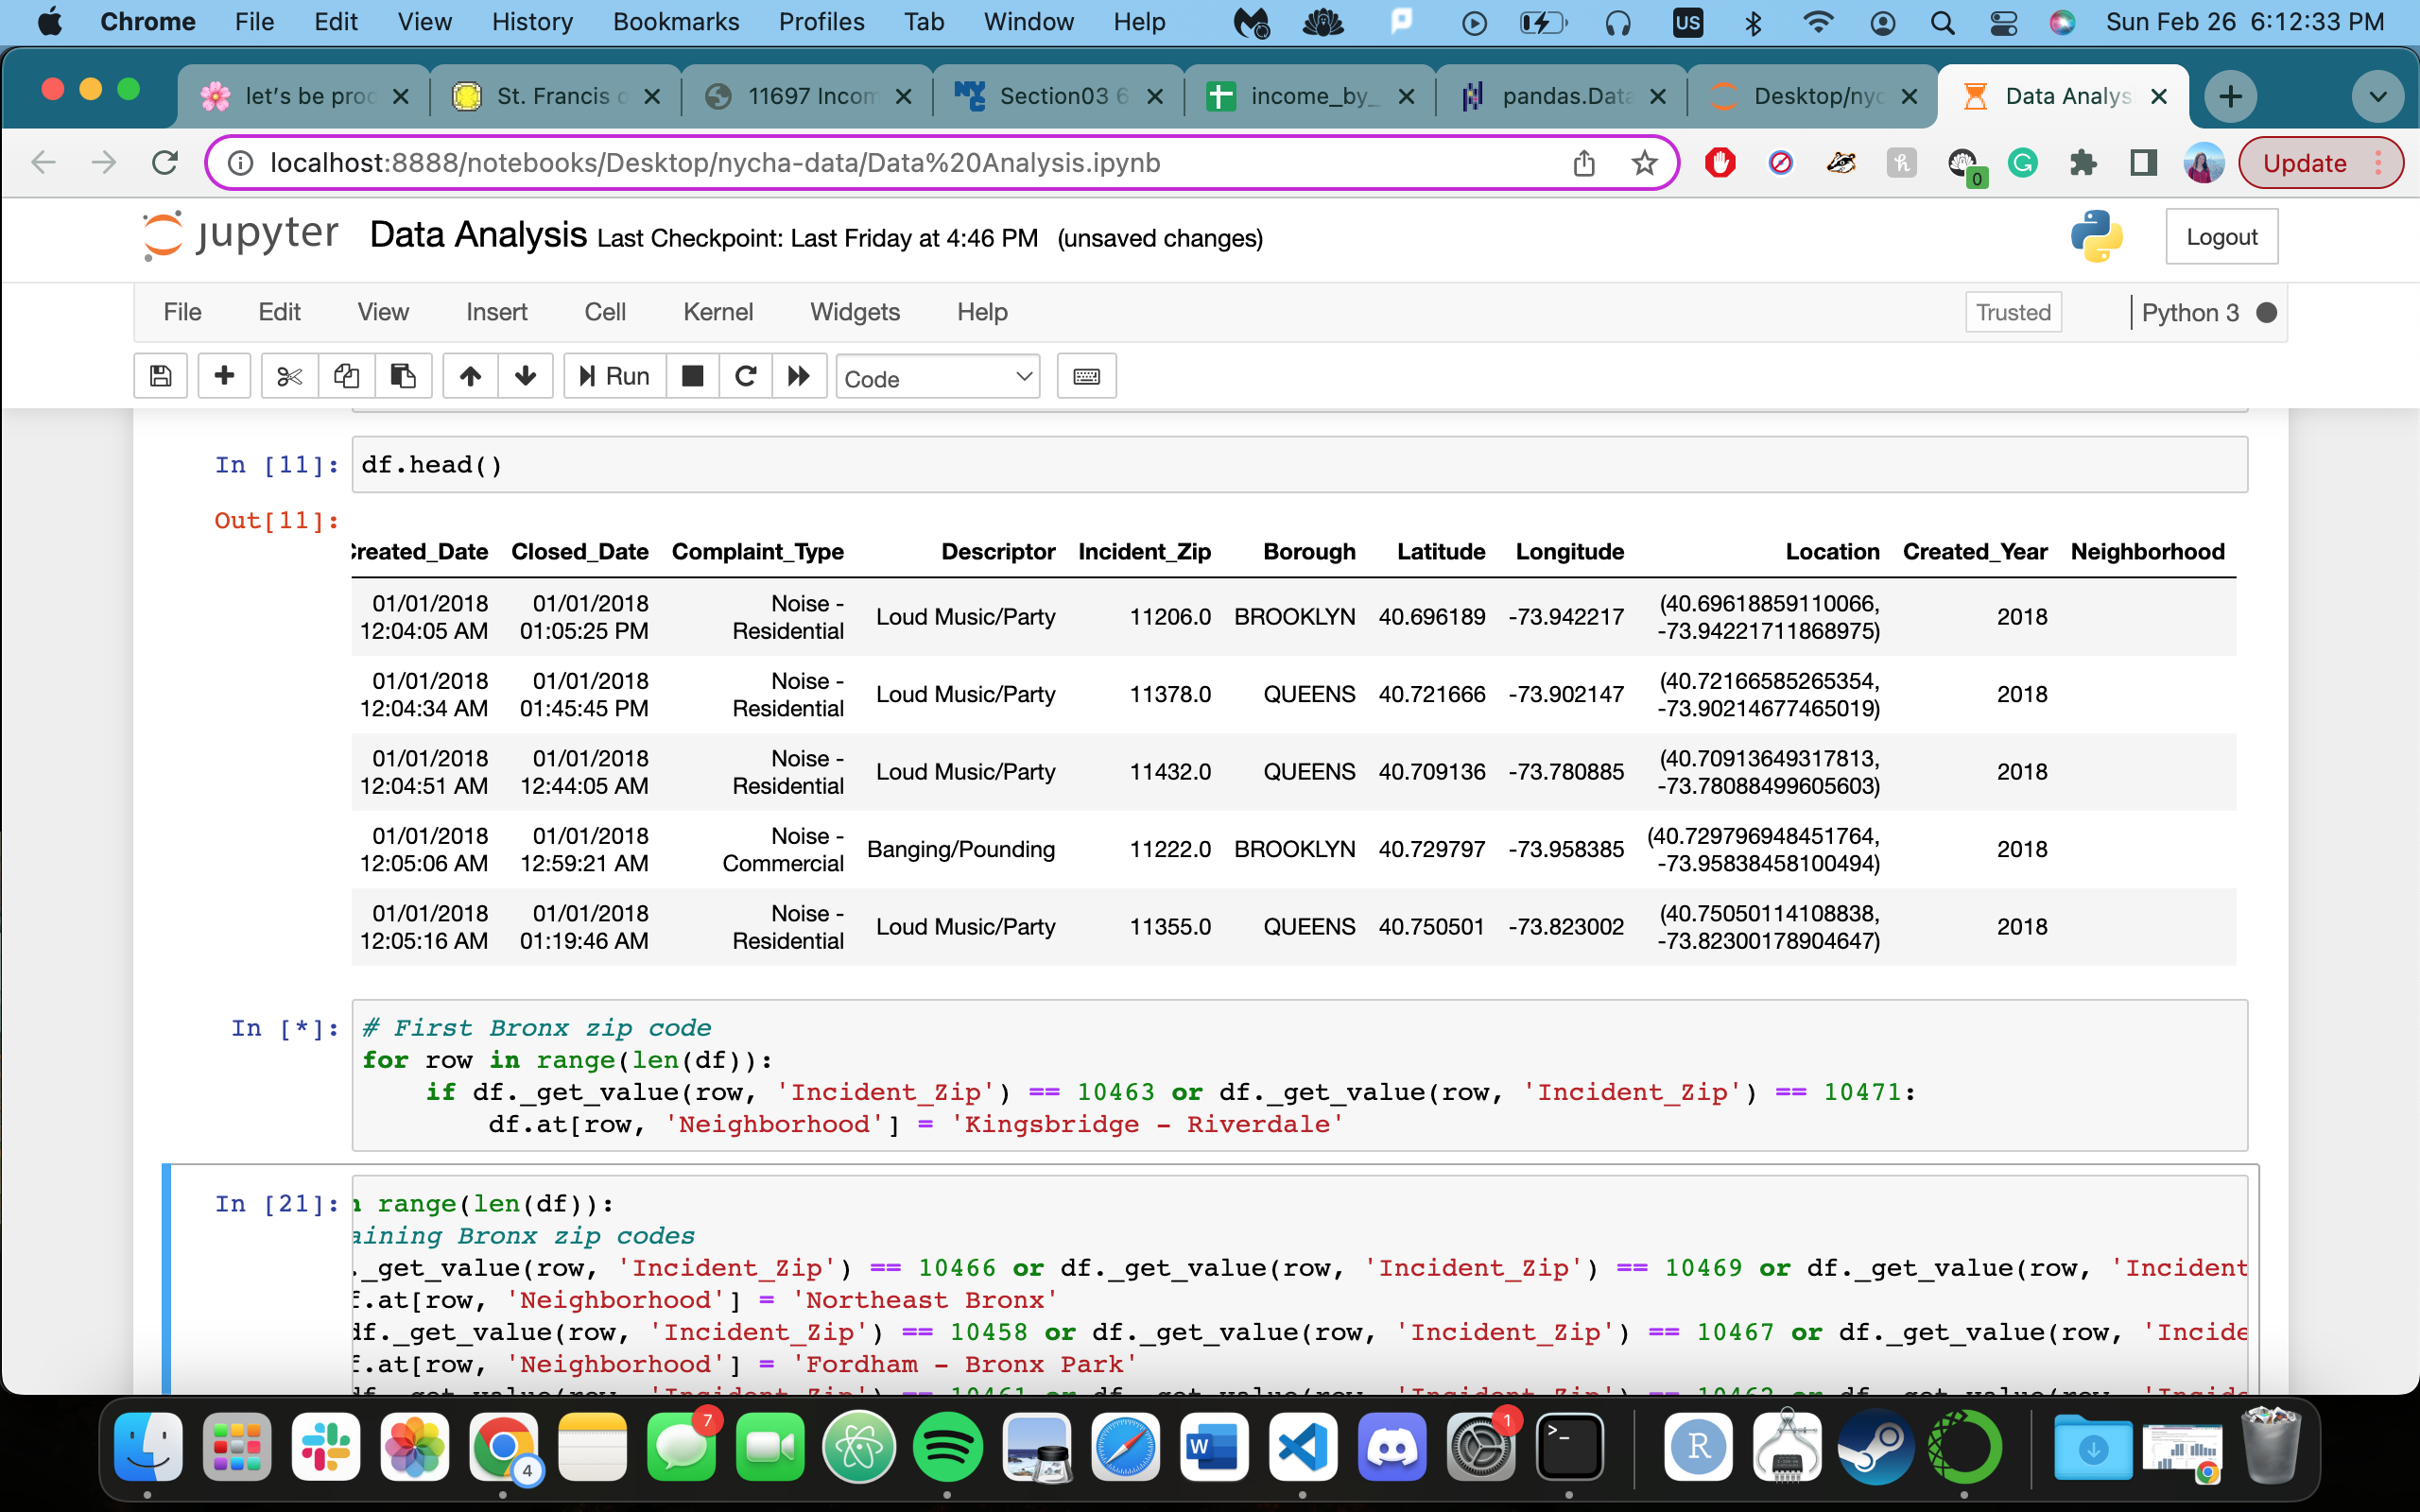
Linking these neighborhood names by zip code was a pretty tedious process that took a lot of computing time. I probably didn’t perform this computation in the most efficient way, but it felt most intuitive to me to use a for loop to iterate through each row of the table and perform a series of if/else if statements to modify the neighborhood column based on the zip code column.
After a couple hours of computing this, I had assigned neighborhood values to most of the rows in the database. Right now, there are still ~32k blank rows whose zip codes didn’t match the ones in the document, but I’m hoping to remedy this soon.
Here are some breakdowns of the neighborhoods + zip codes with the most/least noise complaints from Jan 1 2018 to Dec 31 2022!
Zip Codes with Most Noise Complaints
- 10466 (Northeast Bronx, Bronx): 221,456 complaints
- 10031 (Washington Heights - Inwood, Manhattan): 60,935 complaints
- 10453 (Crotona - Tremont, Bronx): 58,902 complaints
- 10457 (Crotona - Tremont, Bronx): 58,669 complaints
- 10034 (Washington Heights - Inwood, Manhattan): 54,661 complaints
- 10032 (Washington Heights - Inwood, Manhattan): 53,684 complaints
- 10452 (High Bridge - Morrisania, Bronx): 53,496 complaints
- 10468 (Fordham - Bronx Park, Bronx): 53,086 complaints
- 11226 (East Flatbush - Flatbush, Brooklyn): 51,414 complaints
- 10456 (High Bridge - Morrisania, Bronx): 50,428 complaints
Neighborhoods with Most Noise Complaints
- Washington Heights - Inwood, Manhattan: 259,300 complaints
- Northeast Bronx, Bronx: 244,944 complaints
- Crotona - Tremont, Bronx: 150,702 complaints
- Fordham - Bronx Park, Bronx: 145,917 complaints
- Bedford Stuyvesant - Crown Heights: 135,163 complaints
- High Bridge - Morrisania, Bronx: 133,349 complaints
- Central Harlem - Morningside Heights, Manhattan: 119,117 complaints
- Williamsburg - Bushwick, Brooklyn: 118,538 complaints
- East Flatbush - Flatbush, Brooklyn: 114,316 complaints
- Pelham - Throgs Neck, Bronx: 111,030 complaints
Neighborhoods with Least Noise Complaints
- Canarsie - Flatlands (Brooklyn): 29,371
- Sunset Park (Brooklyn): 28,981
- Stapleton - St. George (Staten Island): 27,658
- Southeast Queens (Queens): 26,137
- Rockaway (Queens): 24,171
- Lower Manhattan (Manhattan): 18,359
- South Beach - Tottenville (Staten Island): 16,867
- Port Richmond (Staten Island): 15,185
- Bayside - Little Neck (Queens): 9,719
- Willowbrook (Staten Island): 9,193
Notes on these Results
- Each of the 4 Staten Island neighborhoods are in the neighborhoods with least noise complaints category
- 9 out of 10 of the zip codes with the most noise complaints are in Upper Manhattan + the Bronx
- I might need to check what’s going on with the 10466 zip code, since it seems a bit odd that it has over triple the noise complaints of the second highest zip code.
- The zip code for (10027) has the 22nd most complaints of the 231 zip codes.
Side Note: I unfortunately learned on Sunday evening that if you make changes to a Pandas dataframe, it’s really important to save that dataframe as a new csv because when you close out of your notebook, those changes you make to the original csv are not permament. Meaning that if you spend a few hours adding a new column to your dataframe, you will have to repeat that computation next time you open that Jupyter notebook if you don’t save it as a new csv. After this discovery, I spent a couple hours repeating this new column and definitely saving to csv at the end.
Adding Income Information
I knew from my hypotheses that I was going to want to compare median incomes with noise complaint levels in zip codes, so I decided to pull the median household income for each of the zip codes present on the UHF list I linked above. Note: there are more zip codes in New York City that are not on this list, but a lot of them are technically P.O. boxes or only take the span of a block or so, and there is not enough census/income data because the area is too small.
I made a spreadsheet of all of the zip codes I had previously linked to specific neighborhoods, totaling around 170 zip codes across the five boroughs. For each zip code, I found the median household income from Income by Zip Codes. The site states that their income statistics are the most current ones available from the US Census Bureau and are from the American Community Survey 2021 5-year estimates. Addiitonally, these values are in 2021 inflation-adjusted dollars.
Below is a sample of median household incomes for Manhattan zip codes. 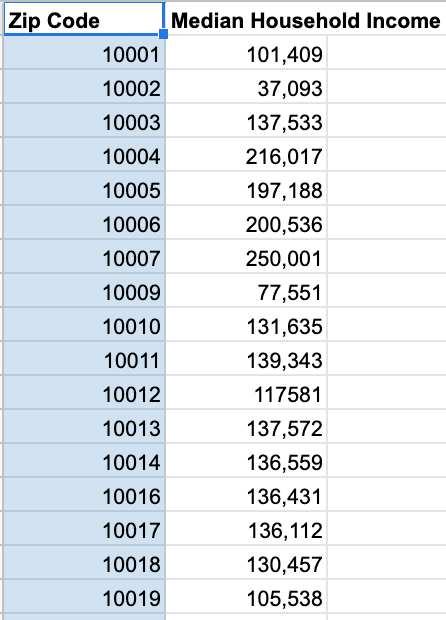
I concluded by reading in this spreadsheet as a new dataframe in Pandas and converting it to a Python dictionary so I’d be able to perform later analysis using this information.