Project Week 5 (aka Check-In Time)
Here’s a brief rundown of what I’ve been up to with this project. My goal is to analyze differences in 311 noise complaint activity in New York City that occurred during the COVID-19 pandemic.
I came in with a couple of hypotheses that I wanted to explore.
- I believed that NYC’s 311 Call Center received on average more complaints about noises in the first three months of the pandemic than the Call Center received in the same period during 2019.
- Meanwhile, I believe the call center will receive on average less complaints about commercial, vehicle, and street/sidewalk noise in these first three months compared to the same period in 2019.
- During this three month period, I believe that low-income zip codes will experience/report more monthly noise complaints on average compared to non low income zip codes.
I sourced my 311 noise complaints from the 311 Dataset from NYC.gov, choosing to only include noise complaints between January 1 2018 and December 31 2022 in order to have a wider timeframe to analyze. After cleaning this data, I performed some exploratory statistics to better understand the patterns I was working with. By the way, I’m currently using Python (mainly Pandas / MatPlotLib) for all of my data analysis!
Exploratory Statistics
The most common 5 types of noise complaints in the period were Noise - Residential, Noise - Street/Sidewalk, Noise - Vehicle, Noise, and Noise - Commercial. The most common 5 noise complaint descriptions were Loud Music/Party, Banging/Pounding, Loud Talking, Car/Truck Music, and Noise: Construction. As you can see below, the loud music + party complaint is the most common description by a mile.
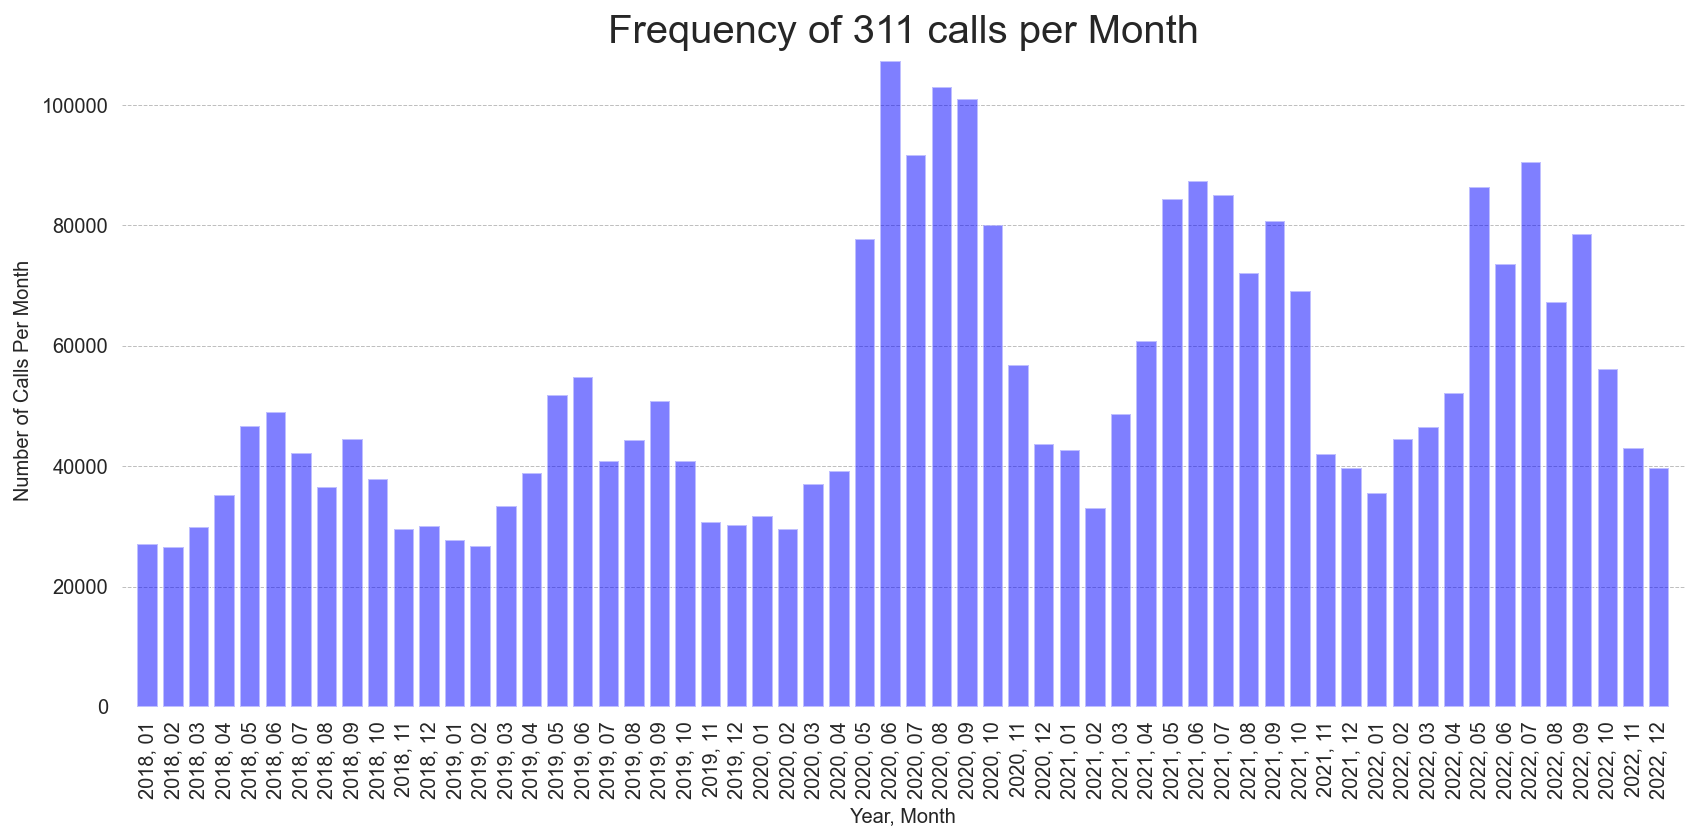
Next, I knew this project was going to be largely focusing on changes in noise complaint call frequency over time, so I thought it would be helpful to create a graph of the number of noise complaints made in New York City during each month in the five month period I was studying (January 2018 - December 2022). I believe this graph is a pretty useful tool for identifying some key patterns for noise complaints, demonstrating both the periodic nature of noise complaints and the large increase in calls which begins in Summer 2020 and never seems to decline to pre-pandemic levels.
In addition to temporal changes, I was interested in gathering information about the differences in noise complaints across zip codes and neighborhoods. While the 311 dataset already includes a zip code category, I thought it was important to add neighborhood labels to each noise complaint. In order to identify neighborhoods by zip codes, I utilized the NYC United Hospital Fund Neighborhood Index which aims to match zip codes to neighborhoods.
After labeling most data entries with a neighborhood, I found the top 5 neighborhoods with the most noise complaints between January 2018 and December 2022 were Washington Heights / Inwood, the Northeast Bronx, Crotona - Tremont, Fordham - Bronx Park, and Bedford-Stuyvesant - Crown Heights. Meanwhile, the 5 neighborhoods with the least noise complaints were Canarsie - Flatlands, Sunset Park, Stapleton - St. George, Southeast Queens, and Rockaway. Repeating the process for zip codes, I found that 9 of the 10 zip codes with the most noise complaints were in Upper Manhattan and the Bronx.
Hypothesis Testing
- Change in Noise Complaint Frequency
First, I had expected that 311 would receive more noise complaints in the first three months of the pandemic than the Call Center received in the same period during 2019. I decided to define the first three months of the pandemic as spanning from 03/01/2020 to 5/31/2020. I’ll be comparing the number of noise complaint calls during this period to the number of calls between 03/01/2019 and 05/31/2019.
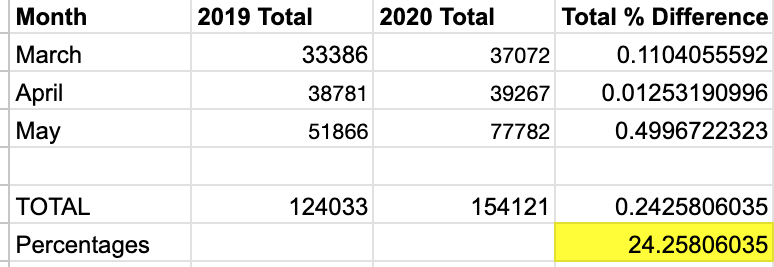
I found a 24% increase in total noise complaints during the March through May 2020 period when compared to the March through May 2019 period.
- Change in Types of Noise Complaints
Next, I had expected that the 311 call center will receive on average less complaints about commercial, vehicle, and street/sidewalk noise in these first three months of the pandemic compared to the same period in 2019.
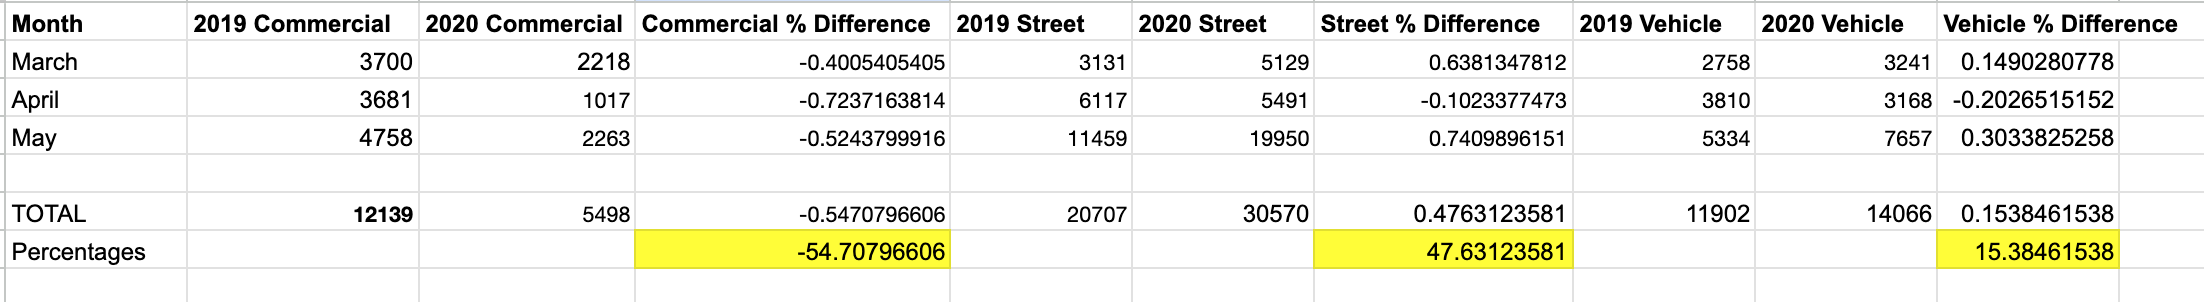
I found a 54% decrease in commercial noise, a 47% increase in street + sidewalk noise, and a 15% increase in vehicle noise. The increased noise levels were initially a surprise to me, but made sense when considering increased outdoor gatherings when the virus was more contained or situations of people stuck in their homes hearing a person’s car alarm go off for 30 minutes.
- Noise Complaint Frequency by Neighborhood
Finally, I wanted to start examining which neighborhoods experienced the largest increases/decreases in noise complaints in the pandemic. I had been noticing that May 2020 was the first month demonstrating some dramatic changes in noise complaint trends that have persisted ever since, so I decided to extend the period I was examining to a six month range, from March, … , August in 2019 and 2020 respectively. I created a separate dataframe for the six month period in each year, and then aggregated values by neighborhood to assess the change in noise complaint frequency.
According to my calculations, the neighborhoods with the largest increases in noise complaints were…
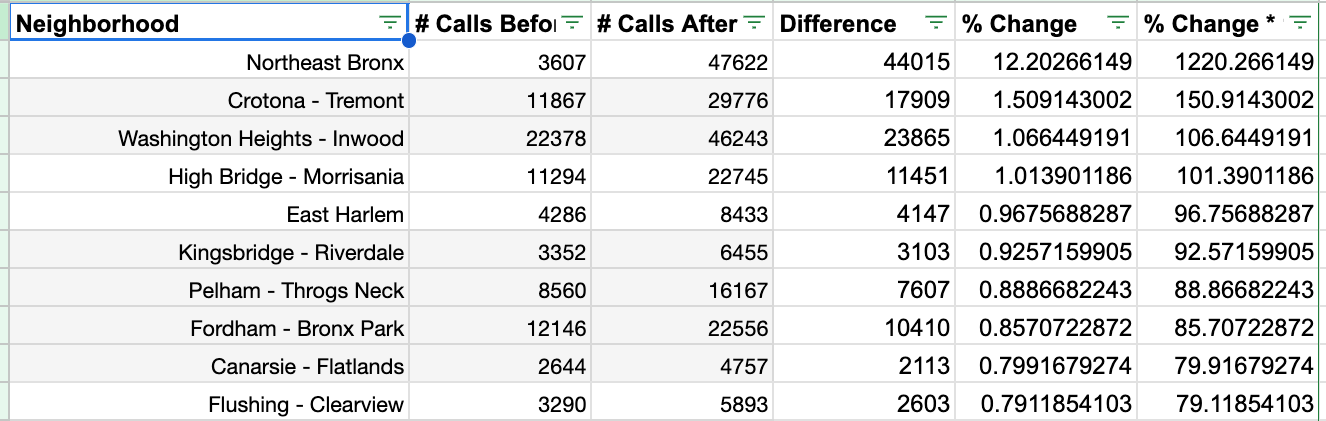
Note: I believe there’s some crazy error going on with overreported noise complaints in 10466, a zip code in the Northeast Bronx which is why there is a 1200% increase in noise complaints for that neighborhood.
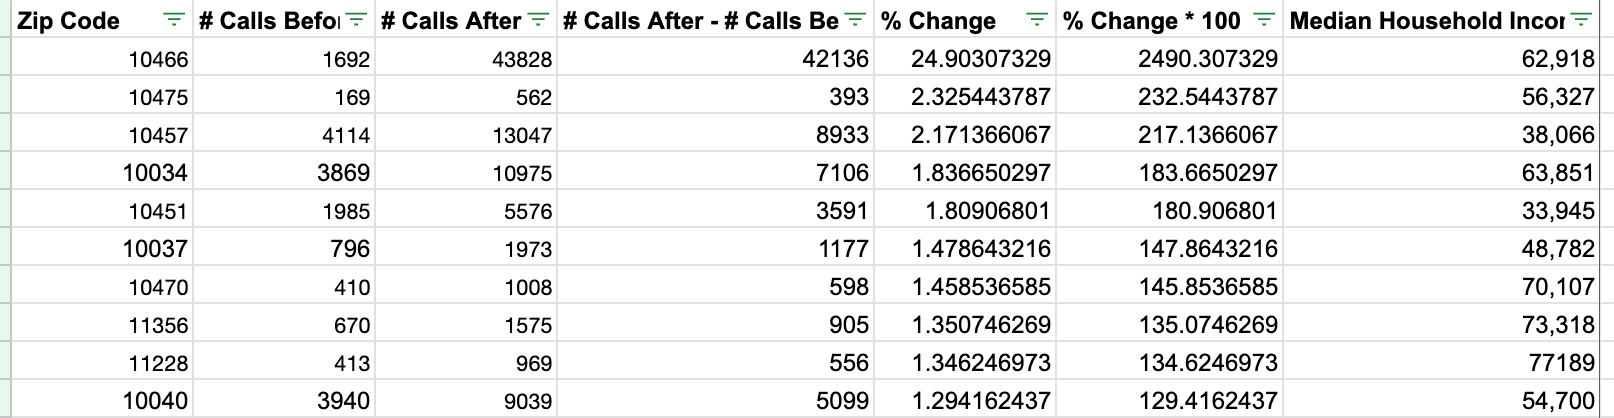
Meanwhile, the zip codes with the largest increases in noise complaints were…
And the zip codes were the largest decreases in noise complaints were…
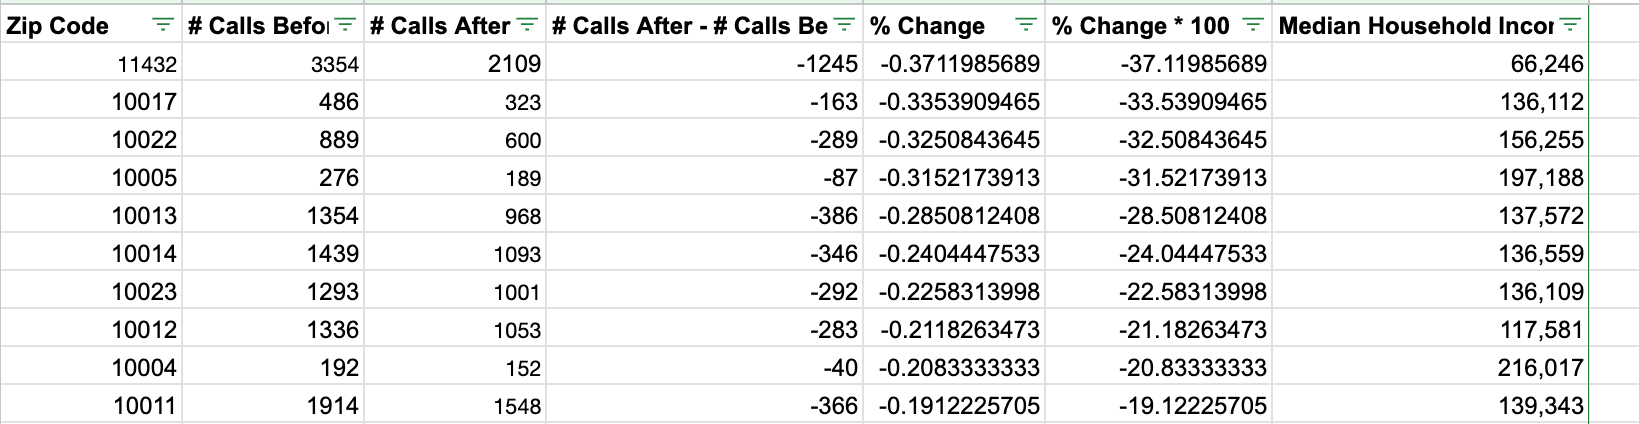
Note: I added median household income information sourced from Income by Zip Codes to each of these zip codes.
What’s Next
- Perform statistical tests on the results I found above (most tricky will probably be the last one)
- Analyzing more periods beyond the start of the pandemic
- Noise complaint prediction / finding other means of exploring the data